

signal strength 1 of 5
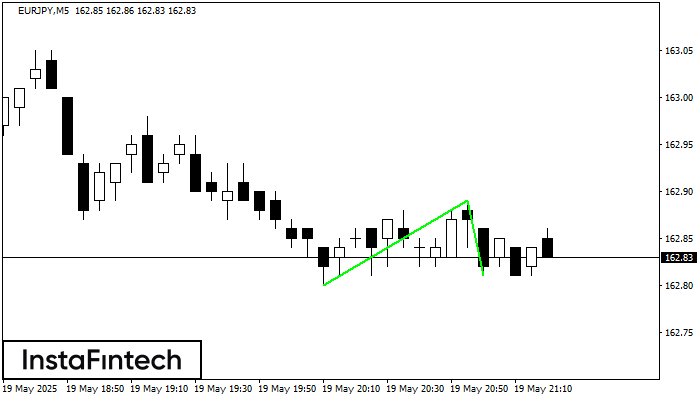
The Double Bottom pattern has been formed on EURJPY M5; the upper boundary is 162.89; the lower boundary is 162.81. The width of the pattern is 9 points. In case of a break of the upper boundary 162.89, a change in the trend can be predicted where the width of the pattern will coincide with the distance to a possible take profit level.
The M5 and M15 time frames may have more false entry points.
Xem thêm
- All
- Double Top
- Flag
- Head and Shoulders
- Pennant
- Rectangle
- Triangle
- Triple top
- All
- #AAPL
- #AMZN
- #Bitcoin
- #EBAY
- #FB
- #GOOG
- #INTC
- #KO
- #MA
- #MCD
- #MSFT
- #NTDOY
- #PEP
- #TSLA
- #TWTR
- AUDCAD
- AUDCHF
- AUDJPY
- AUDUSD
- EURCAD
- EURCHF
- EURGBP
- EURJPY
- EURNZD
- EURRUB
- EURUSD
- GBPAUD
- GBPCHF
- GBPJPY
- GBPUSD
- GOLD
- NZDCAD
- NZDCHF
- NZDJPY
- NZDUSD
- SILVER
- USDCAD
- USDCHF
- USDJPY
- USDRUB
- All
- M5
- M15
- M30
- H1
- D1
- All
- Buy
- Sale
- All
- 1
- 2
- 3
- 4
- 5
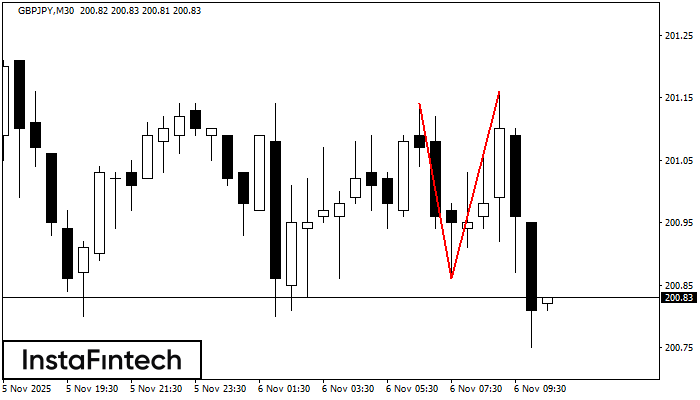
The Double Top reversal pattern has been formed on GBPJPY M30. Characteristics: the upper boundary 201.14; the lower boundary 200.86; the width of the pattern is 30 points. Sell trades
Open chart in a new window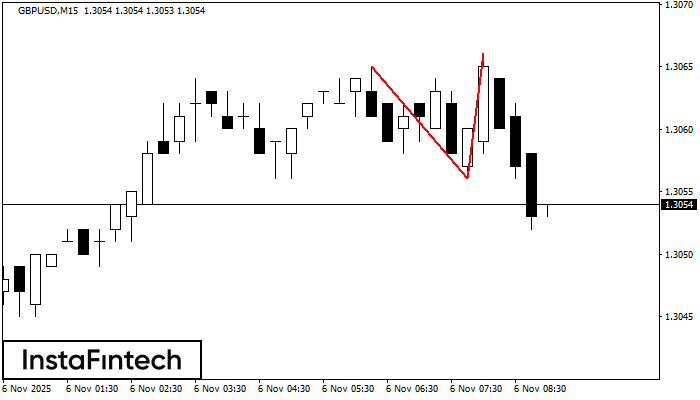
The Double Top pattern has been formed on GBPUSD M15. It signals that the trend has been changed from upwards to downwards. Probably, if the base of the pattern 1.3056
The M5 and M15 time frames may have more false entry points.
Open chart in a new window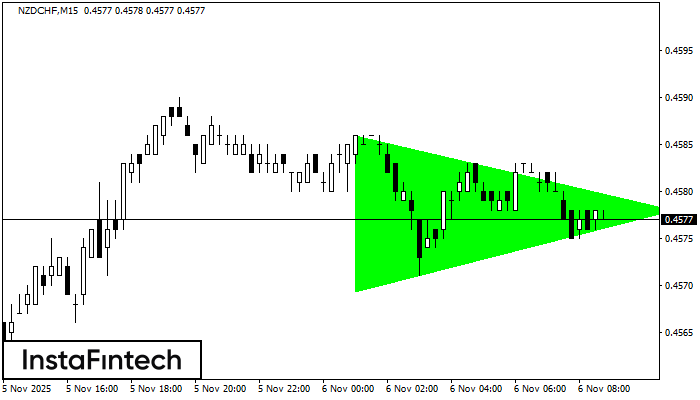
According to the chart of M15, NZDCHF formed the Bullish Symmetrical Triangle pattern, which signals the trend will continue. Description. The upper border of the pattern touches the coordinates 0.4586/0.4578
The M5 and M15 time frames may have more false entry points.
Open chart in a new window


