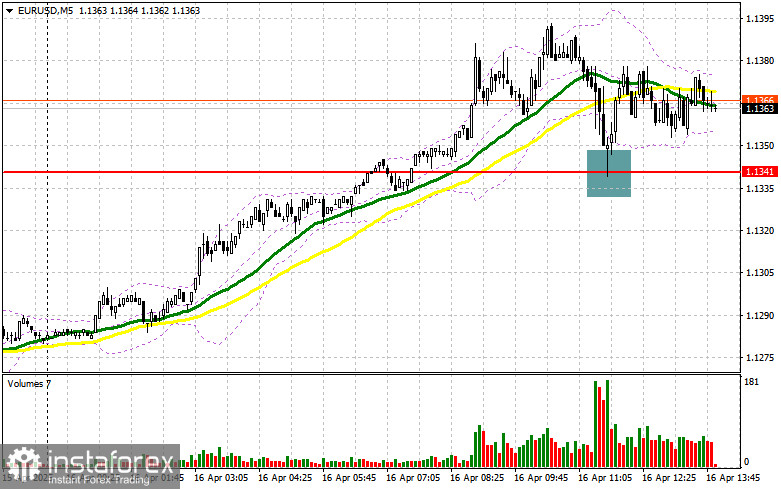
In my morning forecast, I highlighted the 1.1341 level as a key point for market entry decisions. Let's take a look at the 5-minute chart and analyze what happened there. A decline followed by a false breakout around 1.1341 provided a solid entry point for buying the euro, which led to a 40-point rise. The technical outlook was not revised for the second half of the day.
To open long positions on EUR/USD:
Inflation data from the eurozone matched economists' expectations. Given that prices in March showed a year-on-year increase of 2.2%, unchanged from April's reading, the European Central Bank will face difficulties tomorrow in deciding how to proceed with interest rates.
In the second half of the day, we expect some important U.S. data releases. The session begins with retail sales and industrial production figures, followed by a speech from Federal Reserve Chair Jerome Powell. If the U.S. statistics are strong, downward pressure on the euro will likely return—and I plan to use that to my advantage.
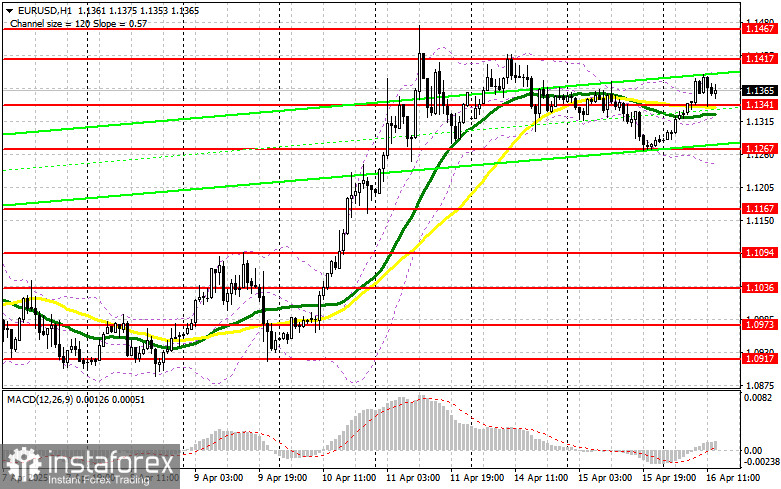
However, only a false breakout near the 1.1341 support—similar to the one seen earlier today—will be a valid signal to buy EUR/USD in anticipation of the continuation of the bullish trend, with the aim of retesting 1.1417, which could not be reached in the first half of the day. A breakout and retest of this range will confirm a proper entry point, targeting the 1.1467 area—this year's high. The most distant target will be 1.1526, where I will lock in profits.
In the event of a decline in EUR/USD and a lack of buyer activity around 1.1341, pressure on the euro will increase, though the pair will likely remain within a sideways channel. In that case, bears may push the price down to 1.1267. Only after a false breakout forms there will I look to go long. I plan to open long positions directly on a rebound from the 1.1167 support, targeting a 30–35 point intraday correction.
To open short positions on EUR/USD:
If U.S. data disappoints and Powell's speech provides no new insights, the euro will likely continue rising. In this scenario, only a false breakout at the 1.1417 resistance will provide a valid entry for short positions, aiming for a drop to the 1.1341 support, where moving averages are currently located, favoring the bulls.
A breakout and consolidation below this range will support further selling, targeting 1.1267. The final target will be the 1.1167 area, where I plan to take profits.
If EUR/USD climbs further during the U.S. session and bears fail to show activity around 1.1417, buyers may attempt to revisit last week's highs. In that case, I'll delay selling until a test of the next resistance at 1.1467, where I will sell only after a failed breakout. I plan to open short positions directly on a rebound from 1.1526, targeting a 30–35 point downward correction.
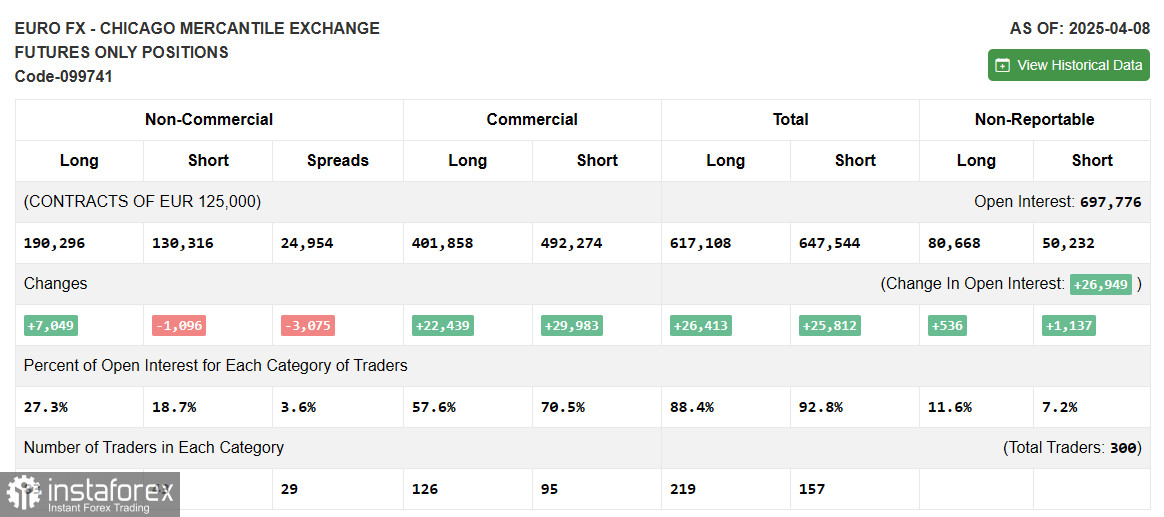
COT Report (Commitments of Traders) – April 8:
The report showed an increase in long positions and a decrease in shorts. Following Trump's announcement of a 90-day tariff freeze, the euro resumed its upward momentum, clearly reflected in the growth of long positions.
The decline in eurozone inflation also spurred demand for the euro, as markets anticipate more decisive ECB actions to stimulate the economy.
According to the report, long non-commercial positions rose by 7,049 to 190,296 and short non-commercial positions fell by 1,096 to 130,316. The net long position increased by 2,466 contracts.
Indicator Signals:
Moving Averages: Trading is occurring near the 30- and 50-day moving averages, indicating a sideways market.
Note: The author analyzes the H1 chart, which may differ from the classic daily moving averages on the D1 timeframe.
Bollinger Bands: In case of a decline, the lower boundary of the indicator around 1.1245 will serve as support.
Indicator Descriptions:
- Moving Average (smooths out volatility and noise to define the current trend), Period: 50, marked in yellow on the chart;
- Moving Average, Period: 30, marked in green on the chart;
- MACD Indicator (Moving Average Convergence/Divergence): Fast EMA – period 12; Slow EMA – period 26; SMA – period 9;
- Bollinger Bands, Period: 20;
- Non-commercial traders: speculators such as individual traders, hedge funds, and large institutions using the futures market for speculative purposes under certain criteria;
- Long non-commercial positions represent the total long open interest from non-commercial traders;
- Short non-commercial positions represent the total short open interest from non-commercial traders;
- Net non-commercial position is the difference between long and short positions of non-commercial traders.