empty
23.09.2024 10:20 AM
Learning and Analysis: Trading Plan for Novice Traders EUR/USD and GBP/USD on 23.09.24

Details from the Economic Calendar on September 20

On Friday, the data on retail sales in the UK were published, showing a 1% increase in August. The actual figure significantly exceeded the forecasts of analytical agencies.

Analysis of Trading Charts from September 20

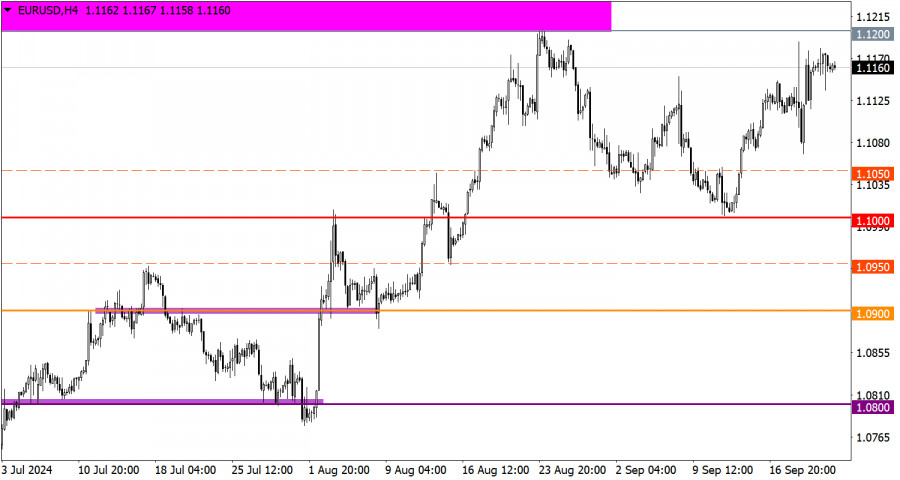
  • EUR/USD Currency Pair

The movement around the local high of the mid-term trend indicates a prevailing bullish sentiment among market participants.

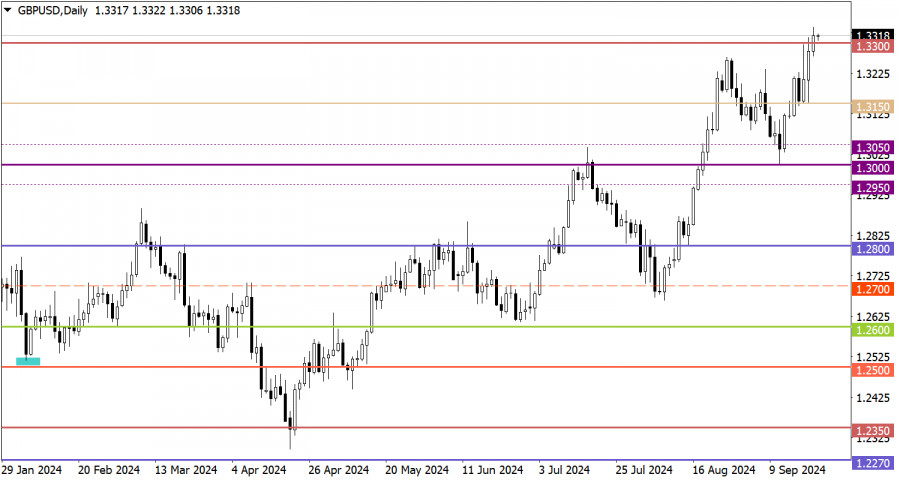
  • GBP/USD Currency Pair

The close of the past trading week above the 1.3300 level indicates a prevailing bullish sentiment among market participants, which has already led to an update of the mid-term high.

This image is no longer relevant

Economic Calendar for September 23

The preliminary estimates of business activity indices are expected to be released today. In the Eurozone and the UK, no significant changes are anticipated for the main indicators, while in the United States, a noticeable decline is projected. Specifically, the composite business activity index in the US is expected to decrease from 54.6 points to 53.0 points.

Trading Plan – EUR/USD

Considering the potential for further selling of dollar positions in financial markets, the euro's upward momentum could lead the price to reach at least the resistance level of 1.1200/1.1280. For more significant price changes, it will be necessary to stabilize above these levels, which would indicate an update of the mid-term high. Until then, the resistance area will continue to exert pressure on buyers.

This image is no longer relevant

Trading Plan – GBP/USD

The price has stabilized above the 1.3300 level, which indicates the potential for further growth of the British pound. A gradual movement toward the 1.3600 level is possible if the upward cycle remains uninterrupted. However, if the price drops below 1.3300, a temporary stagnation or pullback may occur.

This image is no longer relevant

What Is Reflected on the Trading Charts?

  • Candlestick Chart: This consists of rectangular white and black bars with lines at the top and bottom. By analyzing each candle in detail, you can observe its characteristics relative to a specific time period: opening price, closing price, highest price, and lowest price.
  • Horizontal Levels: These represent price coordinates where the market might experience a pause or reversal. In trading, these levels are commonly referred to as support and resistance.
  • Circles and Rectangles: These highlight examples where the price reversed in the past. The color highlights indicate horizontal lines that may exert pressure on the price in the future.
  • Up/Down Arrows: These serve as indicators of potential future price direction.
Gven Podolsky,
انسٹافاریکس کا تجزیاتی ماہر
© 2007-2025
Summary
Urgency
Analytic
Vladislav Tukhmenev
Start trade
انسٹافاریکس کے ساتھ کرپٹو کرنسی کی معاملاتی تبدیلیوں سے کمائیں۔
میٹا ٹریڈر 4 ڈاؤن لوڈ کریں اور اپنی پہلی ٹریڈ کھولیں۔
  • Grand Choice
    Contest by
    InstaForex
    InstaForex always strives to help you
    fulfill your biggest dreams.
    مقابلہ میں شامل ہوں

تجویز کردہ مضامین

15 جولائی کو برطانوی پاؤںڈ/امریکی ڈالر کے لیے تجارتی سفارشات اور تجارتی خرابی: برطانوی پاؤنڈ کمزوری ظاہر کرتا ہے

برطانوی پاؤںڈ/امریکی ڈالر کا 5 منٹ کا تجزیہ برطانوی پاؤںڈ/امریکی ڈالر کرنسی کے جوڑے نے پیر بھر میں نیچے کی طرف حرکت جاری رکھی۔ برطانیہ اور امریکہ دونوں میں میکرو

Paolo Greco 14:40 2025-07-15 UTC+2

15 جولائی کو یورو/امریکی ڈالر کے لیے تجارتی سفارشات اور تجارتی خرابی: یورو کلیدی سطح کے قریب پھنس گیا

یورو/امریکی ڈالر 5 منٹ کا تجزیہ یورو/امریکی ڈالر کرنسی کا جوڑا پیر بھر میں ایک طرف چلا گیا۔ ہمارے پچھلے مضمون میں، ہم نے اندازہ لگایا تھا کہ ہفتے

Paolo Greco 14:34 2025-07-15 UTC+2

14 جولائی کو برطانوی پاؤنڈ/امریکی ڈالر کے لیے تجارتی سفارشات اور تجارتی بریک ڈاؤن۔ برطانوی پاؤنڈ نے مندی کا تعصب برقرار رکھا

برطانوی پاؤنڈ/امریکی ڈالر 5 منٹ کا تجزیہ برطانوی پاؤنڈ/امریکی ڈالر کرنسی کے جوڑے نے جمعہ بھر میں نیچے کی طرف حرکت جاری رکھی۔ ہم یہ نہیں کہہ سکتے

Paolo Greco 14:32 2025-07-14 UTC+2

14 جولائی کو یورو/امریکی ڈالر کے لیے تجارتی سفارشات اور تجارتی بریک ڈاؤن۔ ڈالر تھکا ہوا ہے

یورو/امریکی ڈالر کا 5 منٹ کا تجزیہ یورو/امریکی ڈالر کرنسی کے جوڑے نے جمعہ بھر میں عملی طور پر کوئی کمی نہیں دکھائی۔ جیسا کہ ہم نے پچھلے مضمون

Paolo Greco 14:27 2025-07-14 UTC+2

11 جولائی کو برطانوی پاؤنڈ/امریکی ڈالر کی تجارت کیسے کی جائے؟ نئے افراد کے لیے آسان تجاویز اور تجارتی تجزیہ

جمعرات کا تجارتی جائزہ: برطانوی پاؤنڈ/امریکی ڈالر کا 1گھنٹے کا چارٹ جمعرات کو، برطانوی پاؤنڈ/امریکی ڈالر جوڑے نے اپنی نیچے کی طرف حرکت جاری رکھی، یورو/امریکی ڈالر کی جوڑی

Paolo Greco 10:30 2025-07-11 UTC+2

11 جولائی کو یورو/امریکی ڈالر کی تجارت کیسے کریں؟ نئے افراد کے لیے آسان تجاویز اور تجارتی جائزہ

یورو/امریکی ڈالر کا 1 گھنٹے کا چارٹ جمعرات کا تجارتی جائزہ جمعرات کو، یورو/امریکی ڈالر کرنسی کے جوڑے نے موجودہ رجحان کے مطابق اپنی کمزور نیچے کی حرکت کو جاری

Paolo Greco 10:30 2025-07-11 UTC+2

برطانوی پاؤنڈ/امریکی ڈالر ٹریڈنگ کی سفارشات اور 11 جولائی کے لیے تجارتی جائزہ

برطانوی پاؤنڈ/امریکی ڈالر کا 5 منٹ کا تجزیہ On Thursday, the GBP/USD currency pair continued its moderate decline. Over the past two weeks, the British pound has depreciated

Paolo Greco 10:29 2025-07-11 UTC+2

EUR/USD Trading Recommendations and Trade Review for July 11th

EUR/USD 5M Analysis On Thursday, the EUR/USD currency pair continued its sluggish decline, completely ignoring the fundamental backdrop. As a reminder, this week Donald Trump announced new tariffs targeting both

Paolo Greco 10:10 2025-07-11 UTC+2

10 جولائی کو برطانوی پاؤنڈ/امریکی ڈالر کرنسی کے جوڑے کی تجارت کیسے کریں: نئے افراد کے لیے آسان تجاویز اور تجارتی تجزیہ

بدھ کا تجارتی تجزیہ: برطانوی پاؤنڈ/امریکی ڈالر کا 1 گھنٹے کا چارٹ بدھ کو، برطانوی پاؤنڈ/امریکی ڈالر جوڑا بھی بہت کم اتار چڑھاؤ کے ساتھ، ایک فلیٹ حرکت میں پھنس

Paolo Greco 14:44 2025-07-10 UTC+2

10 جولائی کو یورو/امریکی ڈالر کی کرنسی کے جوڑے کی تجارت کیسے کریں: نئے افراد کے لیے آسان تجاویز اور تجارتی تجزیہ

بدھ کا تجارتی تجزیہ: یورو/امریکی ڈالر - 1گھنٹے کا چارٹ بدھ کو، یورو/امریکی ڈالر جوڑا پچھلے ہفتے کے مروجہ رجحان کے مطابق تجارت کرتا رہا۔ مارکیٹ کی سرگرمی

Paolo Greco 14:39 2025-07-10 UTC+2
ابھی فوری بات نہیں کرسکتے ؟
اپنا سوال پوچھیں بذریعہ چیٹ.
Widget callback
 

Dear visitor,

Your IP address shows that you are currently located in the USA. If you are a resident of the United States, you are prohibited from using the services of InstaFintech Group including online trading, online transfers, deposit/withdrawal of funds, etc.

If you think you are seeing this message by mistake and your location is not the US, kindly proceed to the website. Otherwise, you must leave the website in order to comply with government restrictions.

Why does your IP address show your location as the USA?

  • - you are using a VPN provided by a hosting company based in the United States;
  • - your IP does not have proper WHOIS records;
  • - an error occurred in the WHOIS geolocation database.

Please confirm whether you are a US resident or not by clicking the relevant button below. If you choose the wrong option, being a US resident, you will not be able to open an account with InstaForex anyway.

We are sorry for any inconvenience caused by this message.