Minuette operational scale (H4)
Let me bring to your attention a comprehensive analysis of the options for the development of the movement of AUD / USD vs USD / CAD vs NZD / USD vs #USDX from August 29, 2019 through the Minuette operational scale (H4)
____________________
US dollar Index
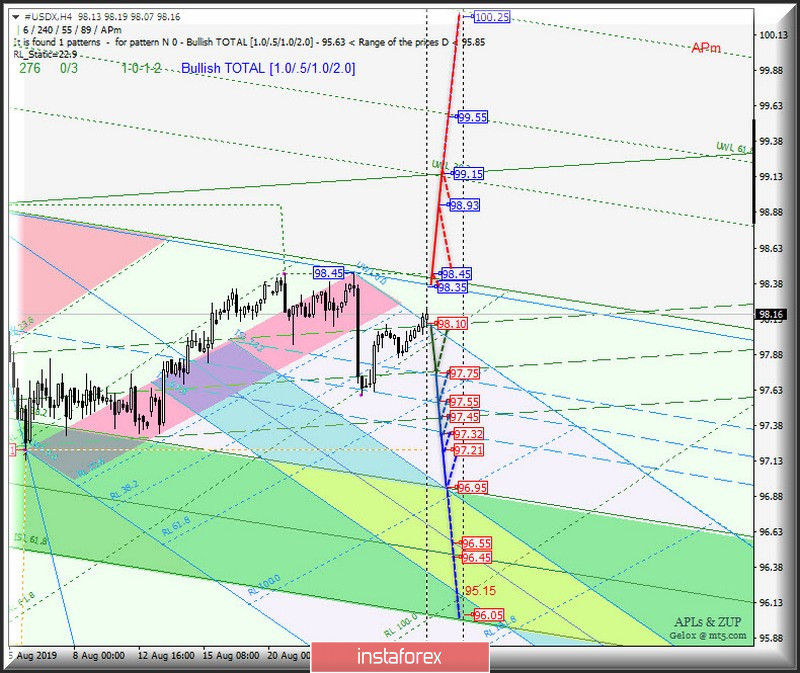
From August 29, 2019, the development of the movement of the dollar index #USDX will be determined by the direction of the breakdown of the range:
- resistance level of 98.35 (control line UTL Minuette operational scale fork);
- support level of 98.10 (upper boundary of the 1/2 Median Line Minuette channel).
The breakdown of the support level of 98.10 - the development of the dollar index movement will continue within the boundaries of 1/2 Median Line channels of the Minuette operational scales fork - (98.10 - 97.75 - 97.45) and Minuette (97.75 - 97.55 - 97.32) with the prospect of reaching the boundaries of the equilibrium zones of the Minuette operational scales fork (96.95 - 96.55 - 95.10) and Minuette (96.95 - 96.45 - 96.05).
With a combined breakdown of the UTL control line (resistance level of 98.35) of the Minuette operational scale fork and updating the local maximum 98.45, the upward movement of #USDX can be continued to the targets - maximum 98.93 - UTL Minuette control line (99.15).
We look at the layout of the #USDX movement options in the animated chart.
____________________
Australian dollar vs US dollar
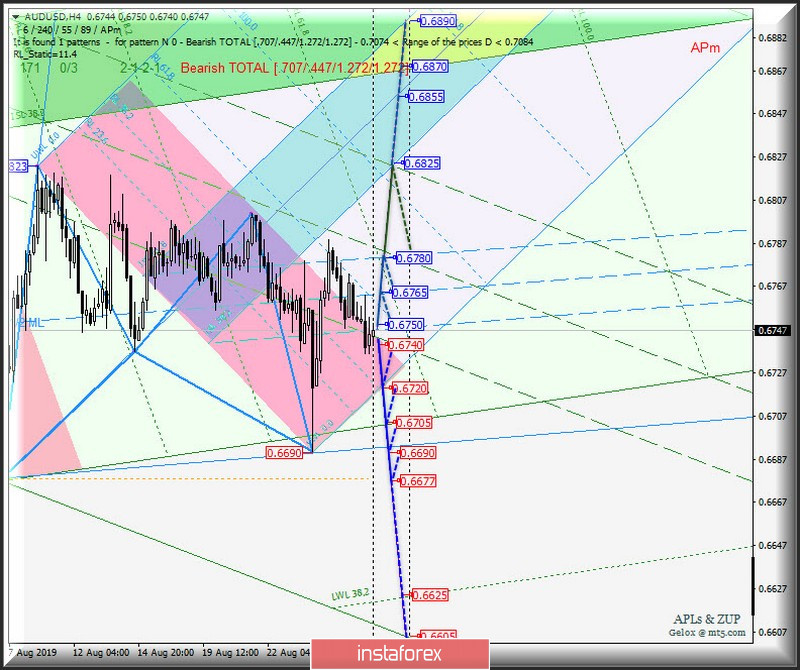
The development of the movement of the Australian dollar/US dollar (AUD / USD) from August 29, 2019 will also be determined by the direction of the breakdown of the range:
- resistance level of 0.6750 (lower boundary of the 1/2 Median Line Minuette channel);
- support level of 0.6740 (lower boundary of the 1/2 Median Line Minuette channel).
The breakdown of the resistance level of 0.6750 will determine the development of the movement of the Australian dollar in the 1/2 Median Line Minuette channel (0.6750 - 0.6765 - 0.6780) with the prospect of reaching the boundaries of the equilibrium zone (0.6825 - 0.6855 - 0.6890) of the Minuette operational scale fork.
The breakdown of the support level of 0.6740 (the lower boundary of the 1/2 Median Line Minuette channel) will make it relevant to continue the downward movement of AUD / USD to the targets - the initial SSL line (0.6720) of the Minuette operational scale fork - the initial line SSL (0.6705) of the Minuette operational scale fork - minimums (0.6690 - 0.6677).
We look at the layout of the AUD / USD movement options in the animated chart.
____________________
New Zealand dollar vs US dollar
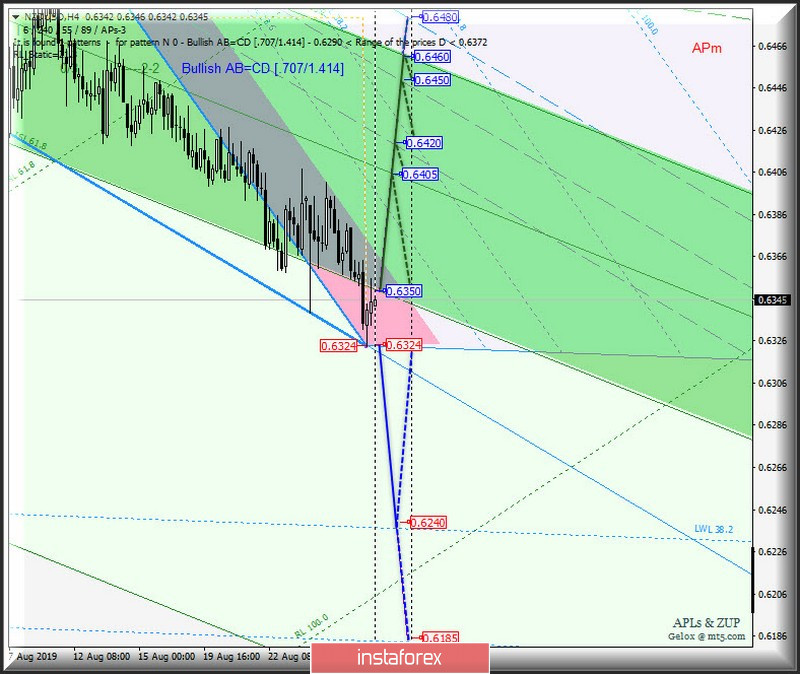
Now, similarly, the development of the movement of the New Zealand dollar/ US dollar (NZD / USD) from August 29, 2019 will also depend on the direction of the breakdown of the range:
- resistance level of 0.6350 (lower boundary ISL61.8 of the equilibrium zone of the Minuette operating scale fork);
- support level of 0.6324 (initial SSL line of the Minuette operational scale fork).
The breakdown of the resistance level of 0.6350 and ISL61.8 Minuette will determine the development of the movement of the NZD/USD within the boundaries of the equilibrium zone (0.6350 - 0.6405 - 0.6460) of the Minuette operational scale fork.
In case of the breakdown of the initial SSL line of the Minuette operational scale fork (support level of 0.6324), the downward movement of NZD / USD can continue to the warning line LWL38.2 Minuette (0.6240).
We look at the layout of the NZD / USD movement options in the animated chart.
____________________
US dollar vs Canadian dollar
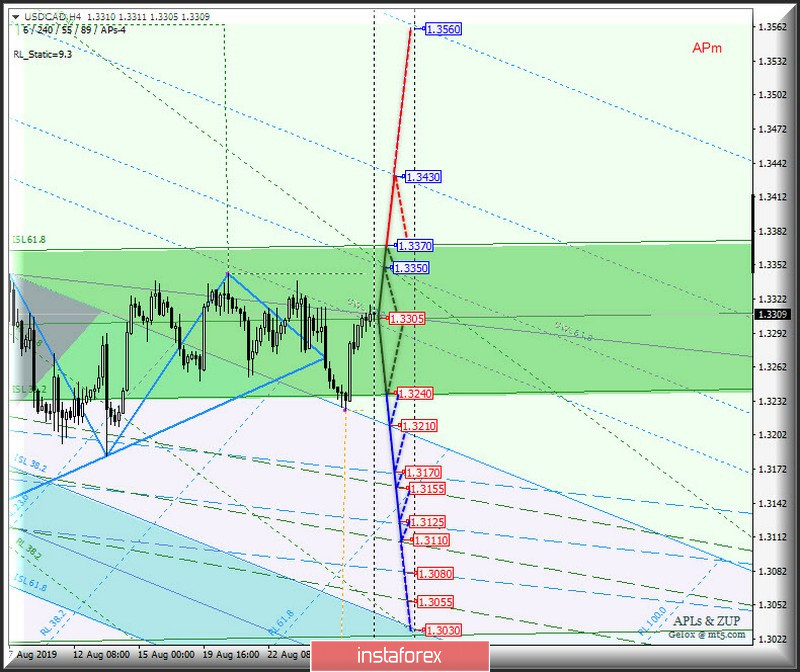
The development and direction of the breakdown of the boundaries of the channel of the equilibrium zone (1.3370 - 1.3305 - 1.3240) of the Minuette operational scale fork will begin to determine the development of the movement of the Canadian dollar/US dollar (USD / CAD) from August 29, 2019. The options for movement inside this equilibrium zone are presented on the animation chart.
The downward movement of USD / CAD will be possible after the breakdown of the support level of 1.3240 at the lower boundary of the ISL38.2 equilibrium zone of the Minuette operational scale fork and this will be directed to the boundaries of the 1/2 Median Line channels of the Minuette operational scales fork (1.3170 - 1.3125 - 1.3080) and Minuette (1.3155 - 1.3110 - 1.3055).
The upward movement of USD / CAD will take place as a result of breakdown of the upper boundary of ISL61.8 (resistance level of 1.31550) of the equilibrium zone of the Minuette operational scale and its targets will be the warning lines UWL100.0 (1.3430) and UWL161.8 (1.3560) of the Minuette operational scale fork.
We look at the layout of the USD / CAD movement options in the animated chart.
____________________
The review is made without taking into account the news background. The opening of trading sessions of major financial centers does not serve as a guide to action (placing orders "sell" or "buy").
The formula for calculating the dollar index:
USDX = 50.14348112 * USDEUR0.576 * USDJPY0.136 * USDGBP0.119 * USDCAD0.091 * USDSEK0.042 * USDCHF0.036.
where the power coefficients correspond to the weights of the currencies in the basket:
Euro - 57.6%;
Yen - 13.6%;
Pound Sterling - 11.9%;
Canadian dollar - 9.1%;
Swedish Krona - 4.2%;
Swiss franc - 3.6%.
The first coefficient in the formula leads the index to 100 at the start date of the countdown - March 1973, when the main currencies began to be freely quoted relative to each other.