empty
23.10.2023 10:53 AM
Weekly forecast based on simplified wave analysis: GBP/USD, AUD/USD, USD/CHF, EUR/JPY, EUR/CHF, and US dollar index on October 23rd

GBP/USD

Brief Analysis:

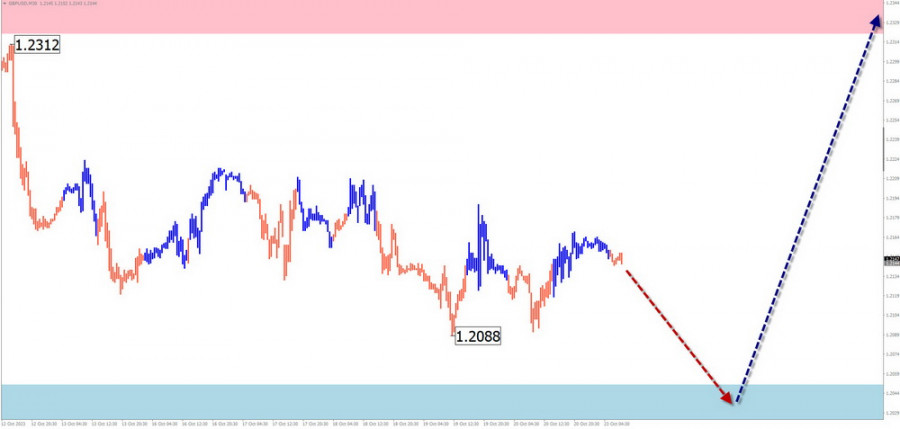
On the British pound chart, a large-scale descending wave has been forming since the beginning of September. Throughout October, a complex corrective pattern in the form of a shifting flat structure has been developing within the wave. At the time of the analysis, it did not show signs of completion. The price is near the lower boundary of a strong potential reversal zone in the weekly time frame.

Weekly Forecast:

At the beginning of the upcoming week, the completion of the price decrease of the British pound is expected, down to the support zone. Following that, a reversal formation and the beginning of a price increase can be anticipated. The resistance zone demonstrates the most probable level of the week's pair trajectory completion.

This image is no longer relevant

Potential Reversal Zones

Resistance:

  • 1.2320/1.2370

Support:

  • 1.2050/1.2000

Recommendations:

Purchases: This will become possible with a fractional lot size after the appearance of corresponding reversal signals in the support area.

Sales: Have limited potential. It is recommended to reduce the lot size and close deals at the first reversal signals.

AUD/USD

Brief Analysis:

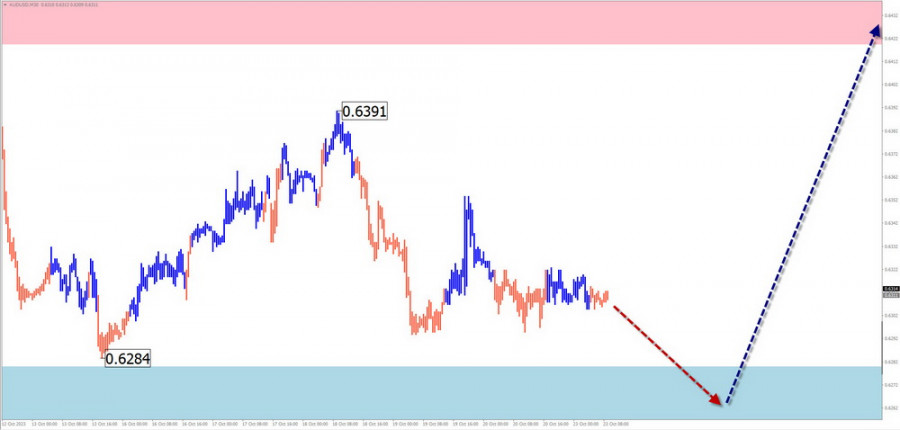
A descending trend continues on the main Australian dollar pair's chart. An unfinished segment started on August 11. Within its structure, the current month has seen a counter-correction in the form of an elongated flat. This wave segment is in its final phase.

Weekly Forecast:

At the beginning of the upcoming week, a movement along the upper boundary of the support is expected. Subsequently, a reversal and the resumption of price increases can be expected. Its completion is most likely within the boundaries of the resistance zone.

This image is no longer relevant

Potential Reversal Zones

Resistance:

  • 0.6420/0.6470

Support:

  • 0.6280/0.6230

Recommendations:

Sales: are quite risky and are not recommended in the coming days.

Purchases: will become possible after the appearance of reversal signals in the support area, according to your trading system.

USD/CHF

Brief Analysis:

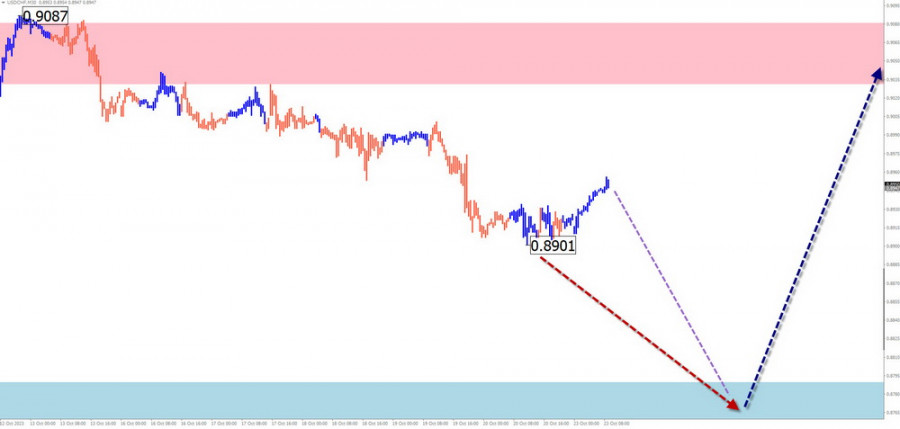
An unfinished bearish wave on the major Swiss Franc chart has been counting since the beginning of November last year. Since a powerful support level in mid-July, the price has been forming a correctional zigzag. At the time of the analysis, the middle part of the wave construction is unfolding.

Weekly Forecast:

A downward trajectory is likely in the next couple of days. Subsequently, an activation and resumption of the upward trajectory are to be expected. The upper boundary of the expected weekly pair trajectory is represented by the calculated resistance.

This image is no longer relevant

Potential Reversal Zones

Resistance:

  • 0.9030/0.9060

Support:

  • 0.8790/0.8740

Recommendations

Sales: Can be used with a fractional lot size for intraday trading in the coming days.

Purchases: will become relevant after the appearance of corresponding signals in the support zone.

EUR/JPY

Brief Analysis:

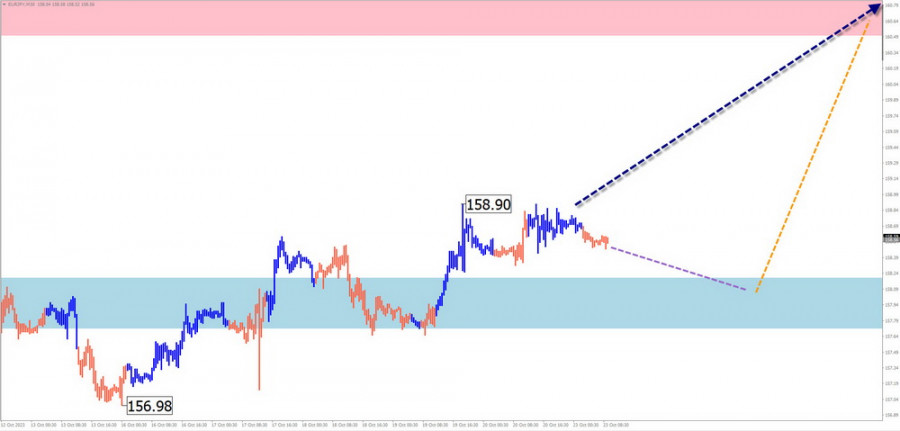
Since March of this year, an ascending wave has determined the main direction of the euro against the Japanese yen. An unfinished segment started on September 26. Over the past two weeks, the price has broken through a strong resistance level and has subsequently relied on it as support. Within this zone, the middle part of the short-term wave (B) has been forming.

Weekly Forecast:

In the next few days, there is a probability of a sideways movement along the support levels. Closer to the weekend, an increase in volatility, a reversal, and a return to the main course of movement can be expected.

This image is no longer relevant

Potential Reversal Zones

Resistance:

  • 160.50/161.00

Support:

  • 158.20/157.70

Recommendations

Sales: highly risky and may lead to losses.

Purchases: May be recommended after the appearance of reversal signals in the support area, as confirmed by your trading system.

EUR/CHF

Brief Analysis:

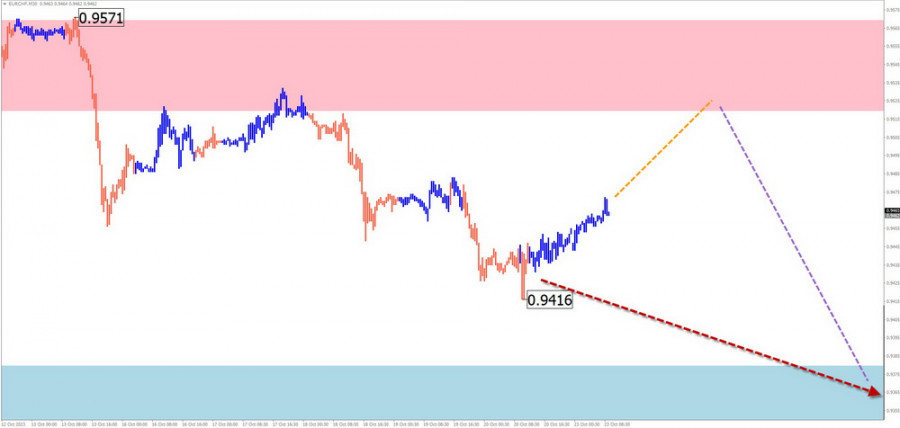
On the euro-to-swiss franc cross chart, a descending trend dominates. An unfinished wave structure in the main direction started in mid-January. Within this, a counter-correction was developed on September 26. The subsequent decline marked the beginning of the final segment (C).

Weekly Forecast:

In the next few days, a flat trend and a short-term retracement towards the resistance zone are likely. Subsequently, a shift to a sideways movement with a reversal formation can be expected. By the end of the week, a resumption of the price decrease can be expected, down to the support levels.

This image is no longer relevant

Potential Reversal Zones

Resistance:

  • 0.9520/0.9570

Support:

  • 0.9380/0.9330

Recommendations

Purchases: have limited potential. Consider reducing your lot size to a minimum and closing deals at the first signs of a reversal.

Sales: will become relevant after the appearance of corresponding signals in the resistance zone, according to your trading systems.

US dollar index

Brief Analysis:

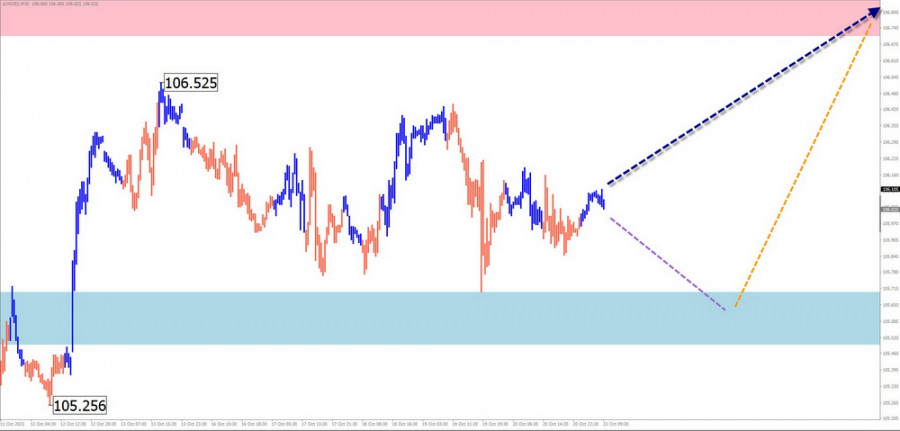
The dollar index continues to recover previously lost positions. Prices rebounded downward from the lower boundary of a strong resistance zone, forming a correctional flat. The current level does not yet indicate reversal potential. The opposing movement remains within the bounds of the correction of the last trending segment.

Weekly Forecast:

At the beginning of the week, a short-term decline in support levels is not ruled out. Subsequently, amidst growing volatility, a resumption of the index's price increase is expected, with quotes rising towards the resistance zone.

This image is no longer relevant

Potential Reversal Zones

Resistance:

  • 106.70/107.20

Support:

  • 105.70/105.20

Recommendations

Purchases: Betting on a stable rise in national currencies in major pairs is premature.

Sales: In the second half of the week, they will become preferable in all major pairs.

Explanation: In simplified wave analysis (SWA), all waves consist of three parts (A, B, and C). On each timeframe (TF), the last unfinished wave is analyzed. Dashed lines indicate expected movements.

Note: The wave algorithm does not consider the duration of movements in time.

Summary
Urgency
Analytic
Vyacheslav Ognev
Start trade
รับผลกำไรจากการเปลี่ยนแปลงอัตราสกุลเงินดิจิทัลกับ InstaForex.
ดาวน์โหลด MetaTrader 4 และเปิดการซื้อขายครั้งแรกของคุณ.
  • Grand Choice
    Contest by
    InstaForex
    InstaForex always strives to help you
    fulfill your biggest dreams.
    เข้าร่วมการแข่งขัน


บทความแนะนำ

การวิเคราะห์ GBP/USD วันที่ 3 ตุลาคม 2025

สำหรับคู่ปอนด์เทียบดอลลาร์ (GBP/USD) โครงสร้างของคลื่นยังคงบ่งบอกถึงการสร้างรูปแบบคลื่นที่มีแนวโน้มเป็นขึ้น ซึ่งไม่ได้มีการเปลี่ยนแปลงในสัปดาห์ที่ผ่านมา ปอนด์ได้ลดลงมากในระยะหลัง จึงทำให้ช่วงแนวโน้มที่เริ่มต้นตั้งแต่วันที่ 1 สิงหาคมดูคลุมเครือ ไอเดียแรกที่คิดขึ้นมาก็คือความซับซ้อนของคลื่นที่คาดว่าเป็นคลื่นที่ 4 ซึ่งอาจจะมีลักษณะเป็นโครงสร้างสามคลื่น โดยแต่ละคลื่นย่อยก็ประกอบไปด้วยคลื่นย่อยสามคลื่นด้วย ในกรณีนี้, ควรคาดหวังการลดลงไปยังระดับ 1.31

Chin Zhao 21:00 2025-10-03 UTC+2

การวิเคราะห์คู่เงิน EUR/USD ประจำวันที่ 3 ตุลาคม 2025

โครงสร้างคลื่นในกราฟ 4 ชั่วโมงของ EUR/USD ได้คงเดิมมาหลายเดือนแล้ว แต่ในช่วงไม่กี่วันที่ผ่านมาเริ่มมีรูปแบบที่ซับซ้อนขึ้น ยังคงเร็วเกินไปที่จะสรุปได้ว่าช่วงแนวโน้มขาขึ้นถูกยกเลิก แต่อาจมีความซับซ้อนของรูปแบบคลื่นเพิ่มขึ้นในอนาคตอันใกล้ ช่วงแนวโน้มขาขึ้นยังคงสร้างต่อไป โดยที่ปัจจัยข่าวมักจะสนับสนุนสกุลเงินอื่นที่ไม่ใช่ดอลลาร์ สงครามการค้าที่ยูนย์ขึ้นโดย Donald Trump ยังคงดำเนินต่อไป การเผชิญหน้ากับ

Chin Zhao 20:56 2025-10-03 UTC+2

การวิเคราะห์ EUR/USD วันที่ 2 ตุลาคม 2025

ค่าเงิน EUR/USD แทบจะไม่เปลี่ยนแปลงในวันพฤหัสบดี และตลอดทั้งสัปดาห์นี้มันได้ขึ้นแค่ 35 จุดฐานเท่านั้น รูปแบบคลื่นบนกราฟ 4 ชั่วโมงสำหรับ EUR/USD ยังคงไม่เปลี่ยนแปลงมาหลายเดือน แต่ในไม่กี่วันที่ผ่านมา มันเริ่มดูซับซ้อนมากขึ้น ยังเร็วเกินไปที่จะสรุปว่าช่วงความเคลื่อนไหวขึ้นได้สิ้นสุดลงแล้ว แต่การซับซ้อนของรูปแบบคลื่นอาจเกิดขึ้นได้ในอนาคตอันใกล้นี้

Chin Zhao 18:52 2025-10-02 UTC+2

การวิเคราะห์ EUR/USD ประจำวันที่ 1 ตุลาคม 2025

โครงสร้างคลื่นในกราฟ 4 ชั่วโมงของคู่เงิน EUR/USD ยังไม่มีการเปลี่ยนแปลงมาหลายเดือน แต่ในช่วงไม่กี่วันที่ผ่านมาได้เกิดรูปแบบที่ซับซ้อนขึ้น. ยังเร็วเกินไปที่จะสรุปว่าส่วนที่เป็นขาขึ้นของแนวโน้มนั้นยกเลิกไปแล้ว แต่โครงสร้างคลื่นที่ซับซ้อนมากขึ้นนั้นมีความเป็นไปได้ในระยะสั้น. การก่อตัวของส่วนขาขึ้นของแนวโน้มยังคงดำเนินต่อไป และข่าวพื้นฐานส่วนใหญ่ยังสนับสนุนยูโรมากกว่าดอลลาร์. สงครามการค้าที่ยกขึ้นโดย Donald Trump ยังคงดำเนินอยู่. การเผชิญหน้ากับ

Chin Zhao 17:17 2025-10-01 UTC+2

การวิเคราะห์ EUR/USD วันที่ 30 กันยายน 2025

โครงสร้างของคลื่นบนกราฟ 4 ชั่วโมงสำหรับ EUR/USD ไม่ได้เปลี่ยนแปลงมาหลายเดือนแล้ว แต่ในไม่กี่วันที่ผ่านมาเริ่มดูซับซ้อนมากขึ้น ยังเร็วเกินไปที่จะสรุปว่าขั้นตอนการขึ้นของแนวโน้มถูกยกเลิก แต่การซับซ้อนของรูปแบบคลื่นเป็นไปได้มาก แนวโน้มการขึ้นยังคงดำเนินต่อไป และข่าวพื้นฐานยังคงไม่สนับสนุนดอลลาร์ ส่วนการทำสงครามการค้าที่โดนัล ทรัมป์เริ่มขึ้นยังดำเนินอยู่ การเผชิญหน้ากับธนาคารกลางสหรัฐ (Fed) ยังคงดำเนินต่อไป

Chin Zhao 21:14 2025-09-30 UTC+2

การวิเคราะห์ EUR/USD ในวันที่ 29 กันยายน 2025

การวิเคราะห์รูปแบบระลอกคลื่นของกราฟ 4 ชั่วโมงสำหรับ EUR/USD ไม่ได้เปลี่ยนแปลงมาหลายเดือน แต่ในช่วงไม่กี่วันที่ผ่านมาเริ่มมีความซับซ้อนมากขึ้น ยังเร็วเกินไปที่จะสรุปได้ว่าช่วงขาขึ้นได้ถูกยกเลิกแล้ว แต่มีโอกาสที่โครงสร้างคลื่นจะมีความซับซ้อนมากขึ้นในอนาคตอันใกล้นี้ ส่วนของแนวโน้มขาขึ้นยังคงสร้างต่อไป และพื้นฐานข่าวยังคงสนับสนุนสกุลเงินอื่นนอกเหนือจากดอลลาร์เป็นส่วนใหญ่ สงครามการค้าที่ริเริ่มโดย Donald Trump ยังคงดำเนินต่อไป การเผชิญหน้ากับ

Chin Zhao 18:27 2025-09-29 UTC+2

การพยากรณ์รายสัปดาห์โดยอิงจากการวิเคราะห์คลื่นที่ง่ายสำหรับ GBP/USD, AUD/USD, USD/CHF, EUR/JPY, AUD/JPY และ Bitcoin ในวันที่ 29 กันยายน

GBP/USD การวิเคราะห์แบบสั้น: ในช่วงสามเดือนที่ผ่านมา คู่เงินปอนด์หลักกำลังสร้างส่วนปรับตัว (B) ภายในเทรนด์ขาขึ้นที่ครอบงำนับตั้งแต่ต้นปี ราคาเคลื่อนที่ด้านข้างตามแนวขอบล่างของโซนการกลับทิศทางที่อาจเกิดขึ้นบนกรอบเวลาแบบรายวัน โครงสร้างคลื่นยังไม่สมบูรณ์ การคาดการณ์รายสัปดาห์: ในอีกไม่กี่วันข้างหน้า คาดว่าปอนด์อังกฤษจะค่อยๆ ลดลงไปยังขอบเขตการสนับสนุน ในช่วงครึ่งหลังของสัปดาห์ อาจมีการกลับทิศทางและเริ่มต้นการเติบโตของราคา โซนความต้านทานจะชี้ถึงขอบเขตบนของช่วงราคาที่คาดการณ์ในสัปดาห์นี้

Isabel Clark 10:07 2025-09-29 UTC+2

การพยากรณ์ประจำสัปดาห์โดยใช้การวิเคราะห์คลื่นแบบง่ายสำหรับ EUR/USD, USD/JPY, GBP/JPY, USD/CAD, NZD/USD, EUR/GBP, และทองคำ ณ วันที่ 29 กันยายน

EUR/USD วิเคราะห์โดยย่อ: แนวโน้มขาขึ้นกำลังกำหนดทิศทางหลักของคู่สกุลเงินยูโรตั้งแต่เดือนกุมภาพันธ์ปีนี้ ส่วนที่ยังไม่เสร็จสมบูรณ์ล่าสุดเริ่มขึ้นในช่วงปลายเดือนกรกฎาคม จากขอบล่างของโซนกลับตัวที่มีศักยภาพแข็งแกร่ง ราคายังคงเคลื่อนไหวด้านข้างซึ่งเริ่มขึ้นเมื่อหนึ่งเดือนครึ่งที่แล้ว โครงสร้างแสดงให้เห็นว่าการปรับฐานยังไม่เสร็จสมบูรณ์ การพยากรณ์รายสัปดาห์: ในอีกไม่กี่วันข้างหน้า ยูโรมีแนวโน้มที่จะเคลื่อนไหวด้านข้างต่อเนื่องไปตามโซนสนับสนุน ต่อมาอาจมีการสร้างเงื่อนไขสำหรับการกลับตัวและเริ่มต้นการเคลื่อนไหวขาขึ้น การปรับขึ้นของราคาหลักอาจขยายไปถึงระดับแนวต้านที่คำนวณไว้ การทะลุผ่านพวกมันภายในช่วงสัปดาห์นั้นมีโอกาสน้อย โซนกลับตัวที่อาจเกิดขึ้น แนวต้าน

Isabel Clark 10:02 2025-09-29 UTC+2

การวิเคราะห์ EUR/USD ณ วันที่ 26 กันยายน 2025

รูปแบบคลื่นบนกราฟ 4 ชั่วโมงของ EUR/USD ยังคงไม่เปลี่ยนแปลงเป็นเวลาหลายเดือน แต่ในช่วงวันที่ผ่านมาเริ่มดูซับซ้อนมากขึ้น ยังเร็วเกินไปที่จะสรุปได้ว่าช่วงแนวโน้มขาขึ้นถูกยกเลิก แต่โครงสร้างคลื่นที่ซับซ้อนในระยะสั้นนั้นเป็นไปได้มากขึ้น ช่วงแนวโน้มขาขึ้นยังคงดำเนินต่อไป ในขณะที่ข่าวภูมิหลังยังคงสนับสนุนส่วนใหญ่ไม่ใช่ดอลลาร์ สงครามการค้าที่ยังมีอยู่ที่ริเริ่มโดย Donald Trump ยังคงดำเนินต่อไป การเผชิญหน้ากับ

Chin Zhao 20:12 2025-09-26 UTC+2

การวิเคราะห์ EUR/USD ประจำวันที่ 25 กันยายน 2025

รูปแบบคลื่นบนกราฟ 4 ชั่วโมงของ EUR/USD ไม่ได้เปลี่ยนแปลงไปหลายเดือน ซึ่งเป็นสัญญาณที่ดีมาก แม้แต่ตอนที่คลื่นแก้ไขกำลังเริ่มสร้างขึ้น โครงสร้างยังคงไม่เปลี่ยนแปลง ซึ่งทำให้การคาดการณ์ต่างๆ แม่นยำขึ้น นอกจากนี้ ควรจดจำว่ารูปแบบคลื่นไม่ได้มีลักษณะตามตัวอย่างในตำราเสมอไป ขณะนี้โครงสร้างยังดูดีมาก แนวโน้มขาขึ้นยังคงกำลังก่อรูปขึ้น ในขณะที่พื้นหลังของข่าวส่วนใหญ่ไม่ได้สนับสนุนดอลลาร์

Chin Zhao 19:17 2025-09-25 UTC+2
หากไม่สะดวกคุยในตอนนี้
ระบุคำถามไว้ได้ใน แชท.
Widget callback
 

Dear visitor,

Your IP address shows that you are currently located in the USA. If you are a resident of the United States, you are prohibited from using the services of InstaFintech Group including online trading, online transfers, deposit/withdrawal of funds, etc.

If you think you are seeing this message by mistake and your location is not the US, kindly proceed to the website. Otherwise, you must leave the website in order to comply with government restrictions.

Why does your IP address show your location as the USA?

  • - you are using a VPN provided by a hosting company based in the United States;
  • - your IP does not have proper WHOIS records;
  • - an error occurred in the WHOIS geolocation database.

Please confirm whether you are a US resident or not by clicking the relevant button below. If you choose the wrong option, being a US resident, you will not be able to open an account with InstaForex anyway.

We are sorry for any inconvenience caused by this message.