empty
12.01.2024 04:26 PM
Trading Signals for BTC (Bitcoin) on January 12-16, 2024: sell below $46,400 (21 SMA - rebound)

This image is no longer relevant

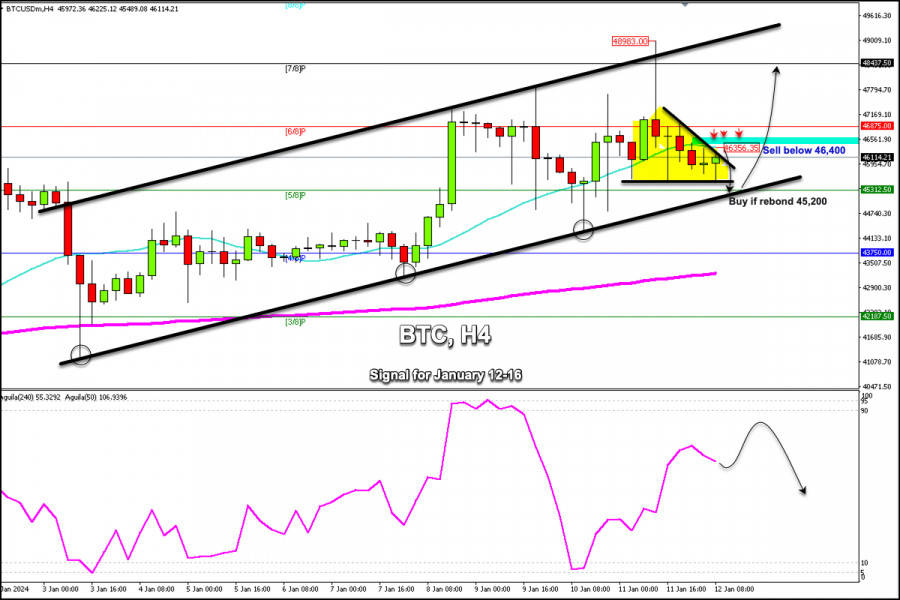
In the morning of the American session, Bitcoin (BTC) is trading at around 46,114, bouncing after having reached the weekly support of around 45,489. In the H4 chart, we can see that Bitcoin has been moving within an uptrend channel since January 3. If it trades above 46,400 again, it could resume its bullish cycle and BTC could reach 48,437.

Given that BTC is under strong bearish pressure after having reached the maximum of 48,983, the price could consolidate below the 21 SMA located at 46,356 in the coming hours. BTC may also trade within a range zone below 6/8 Murray and above the bottom of the uptrend channel around 45,200, this level coincides with 5/8 Murray which could offer good support and an opportunity to buy

According to the H4 chart, Bitcoin still maintains bullish momentum and we hope that it could reach the psychological level of $50,000 in the coming days. For this, the key and condition will be to settle above 6/8 Murray located at 46,875.

If this condition is not met, Bitcoin could come under strong downward pressure and we could expect it to reach 4/8 Murray located at 43,750. In turn, this would cause the bullish trend channel to break and open the way for a new technical correction cycle. As a result, BTC could reach the levels of the 200 EMA located at 43,150 and finally at 3/8 Murray at 42,187.

Summary
Urgency
Analytic
Dimitrios Zappas
Start trade
รับผลกำไรจากการเปลี่ยนแปลงอัตราสกุลเงินดิจิทัลกับ InstaForex.
ดาวน์โหลด MetaTrader 4 และเปิดการซื้อขายครั้งแรกของคุณ.
  • Grand Choice
    Contest by
    InstaForex
    InstaForex always strives to help you
    fulfill your biggest dreams.
    เข้าร่วมการแข่งขัน


บทความแนะนำ

การพยากรณ์ EUR/USD สำหรับวันที่ 5 กันยายน 2025

EUR/USD ยูโรยังไม่สามารถทะลุผ่านระดับแนวรับที่ 1.1632 ได้ (แม้ว่าในระดับปิดรายวัน) ก่อนหน้าที่ข้อมูลการจ้างงานของสหรัฐฯ จะประกาศในวันนี้ ออสซิลเลเตอร์ Marlin ได้อยู่ที่เส้นแบ่งระหว่างแนวโน้มเป็นเวลาสามวัน ซึ่งส่งสัญญาณความเป็นกลางอย่างชัดเจน ข้อมูลการจ้างงานในภาคเอกชนของ ADP เมื่อวานนี้แสดงให้เห็นการเพิ่มขึ้นของงานจำนวน

Laurie Bailey 05:19 2025-09-05 UTC+2

พยากรณ์ GBP/USD สำหรับวันที่ 5 กันยายน 2025

GBP/USD ในกราฟรายวัน ราคาได้ปรับตัวขึ้นเหนือเส้นดัชนีสมดุล และตัวบอกออสซิลเลเตอร์ Marlin ยังคงอยู่ในแดนบวก ซึ่งเป็นเงื่อนไขเบื้องต้นสำหรับการเติบโตสู่เป้าหมายใกล้เคียงที่ 1.3525 อย่างไรก็ตาม มีปัจจัยสำคัญที่จะต้องพิจารณา—วันนี้จะมีรายงานข้อมูลการจ้างงานของสหรัฐ หากตัวเลขออกมาดี อาจส่งผลให้ราคาปรับตัวต่ำกว่าระดับแนวรับที่ 1.3364 ดังเช่นที่เกิดขึ้นเมื่อวันที่

Laurie Bailey 05:19 2025-09-05 UTC+2

สัญญาณการซื้อขายสำหรับ EUR/USD ประจำวันที่ 4-10 กันยายน 2025: ขายต่ำกว่า 1.1733 (200 EMA - 6/8 Murray)

ยูโรมีการซื้อขายในช่วงของระดับสูงและต่ำระหว่างต่ำกว่า 1.1733 และสูงกว่า 1.1580 ในวันต่อ ๆ ไป ยูโรคาดว่าจะมาถึงระดับ 6/8 ของ Murray ที่ 1.1596 หรือแม้แต่ถ้ามีการทะลุลงต่ำกว่าพื้นที่นี้คมชัด เราคาดว่า

Dimitrios Zappas 18:12 2025-09-04 UTC+2

สัญญาณการซื้อขายสำหรับ BITCOIN (BTC/USD) ระหว่างวันที่ 4-8 กันยายน 2025: ซื้อเมื่อราคาสูงกว่า $109,375 (4/8 Murray - 21 SMA)

ตอนนี้ Bitcoin อยู่ต่ำกว่าค่าเฉลี่ยเคลื่อนที่ 21 วัน (21SMA) และมีแนวโน้มที่จะลดลงอย่างต่อเนื่องในไม่กี่ชั่วโมงข้างหน้า โดยอาจไปถึงระดับ 5/8 Murray ที่ 109,375 และอาจกลับไปที่ระดับ 2/8 Murray

Dimitrios Zappas 17:51 2025-09-04 UTC+2

สัญญาณการเทรดสำหรับทองคำ (XAU/USD) สำหรับวันที่ 4-8 กันยายน 2025: ขายต่ำกว่า 3,554 (21 SMA - 7/8 Murray)

จากจุดสูงสุดตลอดกาลที่ 3,579 เมื่อปิดตลาดอเมริกาในวันพุธ ทองลดลงอย่างรวดเร็วเหลือ 3,513 ในเวลาไม่ถึง 8 ชั่วโมงในช่วงตลาดเอเชีย และได้ดีดตัวกลับมาถึงระดับ 3,558 พื้นที่นี้แสดงถึงระดับ 61.8% ของฟีโบนักชี ดังนั้นเราเชื่อว่าอาจเกิดการเคลื่อนไหวที่ค่อนข้างคงที่ต่ำกว่าโซนนี้ในอีกไม่กี่วันข้างหน้า โดยมีเป้าหมายที่

Dimitrios Zappas 17:34 2025-09-04 UTC+2

การคาดการณ์ค่าเงิน EUR/USD ประจำวันที่ 4 กันยายน 2025

วันพุธที่ผ่านมา EUR/USD ได้ปรับทิศทางอีกครั้งภายในช่องแนวนอนอย่างมีนัยสำคัญในด้านของยูโร และยืนอยู่เหนือโซน 1.1637–1.1645 การดีดตัวออกจากโซนนี้ในวันนี้จะส่งผลบวกในด้านของยูโร และทำให้ราคาขึ้นไปใหม่ที่ระดับ Fibonacci 76.4% ที่ 1.1695 หากไม่สามารถยืนได้ต่ำกว่าโซน 1.1637–1.1645 จะบ่งชี้ถึงการกลับมาลดลงในทิศทางของระดับการปรับฐาน 50.0%

Samir Klishi 12:33 2025-09-04 UTC+2

การคาดการณ์สำหรับ GBP/USD ในวันที่ 4 กันยายน 2025

ในกราฟรายชั่วโมงของ GBP/USD เมื่อวันพุธที่ผ่านมาคู่นี้ดีดตัวจากโซนแนวรับที่ 1.3357–1.3364 และปรับตัวกลับมาเป็นบวกให้กับปอนด์ พร้อมกับยืนเหนือโซน 1.3416–1.3425 ได้สำเร็จ ดังนั้นกระบวนการเติบโตอาจดำเนินต่อไปในทิศทางระดับ Fibonacci ถัดไปที่ 76.4% – 1.3482 อย่างไรก็ตาม

Samir Klishi 12:29 2025-09-04 UTC+2

การคาดการณ์ Forex 04/09/2025: EUR/USD, USD/JPY, USDX, ทองคำ และบิตคอยน์

ลิงก์ที่มีประโยชน์: บทความอื่น ๆ ของฉันสามารถดูได้ในส่วนนี้ คอร์ส InstaForex สำหรับผู้เริ่มต้น การวิเคราะห์ยอดนิยม เปิดบัญชีซื้อขาย สำคัญ: ผู้เริ่มต้นในตลาด Forex ควรระมัดระวังอย่างมากเมื่อทำการตัดสินใจในการเข้าสู่ตลาด ก่อนการเผยแพร่รายงานสำคัญ ควรหลีกเลี่ยงการเข้าตลาดเพื่อไม่ให้ตกอยู่ในภาวะความผันผวนที่รุนแรงเนื่องจากความผันผวนที่เพิ่มขึ้น

Sebastian Seliga 11:10 2025-09-04 UTC+2

GBP/USD. การวิเคราะห์ตัวบ่งชี้ประจำวันที่ 4 กันยายน 2025

วิเคราะห์แนวโน้ม (รูปที่ 1) ในวันพฤหัสบดี ตลาดอาจเริ่มเคลื่อนที่ลงจากระดับ 1.3440 (ราคาปิดรายวันเมื่อวาน) โดยมีเป้าหมายที่ 1.3313 ซึ่งเป็นระดับย่อกลับ 61.8% (เส้นประสีเหลือง) จากระดับนี้ ราคามีโอกาสดีดกลับขึ้น โดยมีเป้าหมายที่

Stefan Doll 10:58 2025-09-04 UTC+2

EUR/USD. การวิเคราะห์ตัวชี้วัดในวันที่ 4 กันยายน 2025

การวิเคราะห์แนวโน้ม (รูปที่ 1) เมื่อวันพฤหัสบดี ตลาดจากระดับ 1.1660 (ราคาปิดของวันก่อน) อาจเริ่มเคลื่อนตัวลง โดยมีเป้าหมายที่ระดับ 1.1594 ซึ่งเป็นระดับการปรับฐาน 50% (เส้นประสีเหลือง) เมื่อทดสอบที่ระดับนี้ ราคาอาจดีดกลับขึ้นไปที่ระดับ

Stefan Doll 10:50 2025-09-04 UTC+2
หากไม่สะดวกคุยในตอนนี้
ระบุคำถามไว้ได้ใน แชท.
Widget callback
 

Dear visitor,

Your IP address shows that you are currently located in the USA. If you are a resident of the United States, you are prohibited from using the services of InstaFintech Group including online trading, online transfers, deposit/withdrawal of funds, etc.

If you think you are seeing this message by mistake and your location is not the US, kindly proceed to the website. Otherwise, you must leave the website in order to comply with government restrictions.

Why does your IP address show your location as the USA?

  • - you are using a VPN provided by a hosting company based in the United States;
  • - your IP does not have proper WHOIS records;
  • - an error occurred in the WHOIS geolocation database.

Please confirm whether you are a US resident or not by clicking the relevant button below. If you choose the wrong option, being a US resident, you will not be able to open an account with InstaForex anyway.

We are sorry for any inconvenience caused by this message.