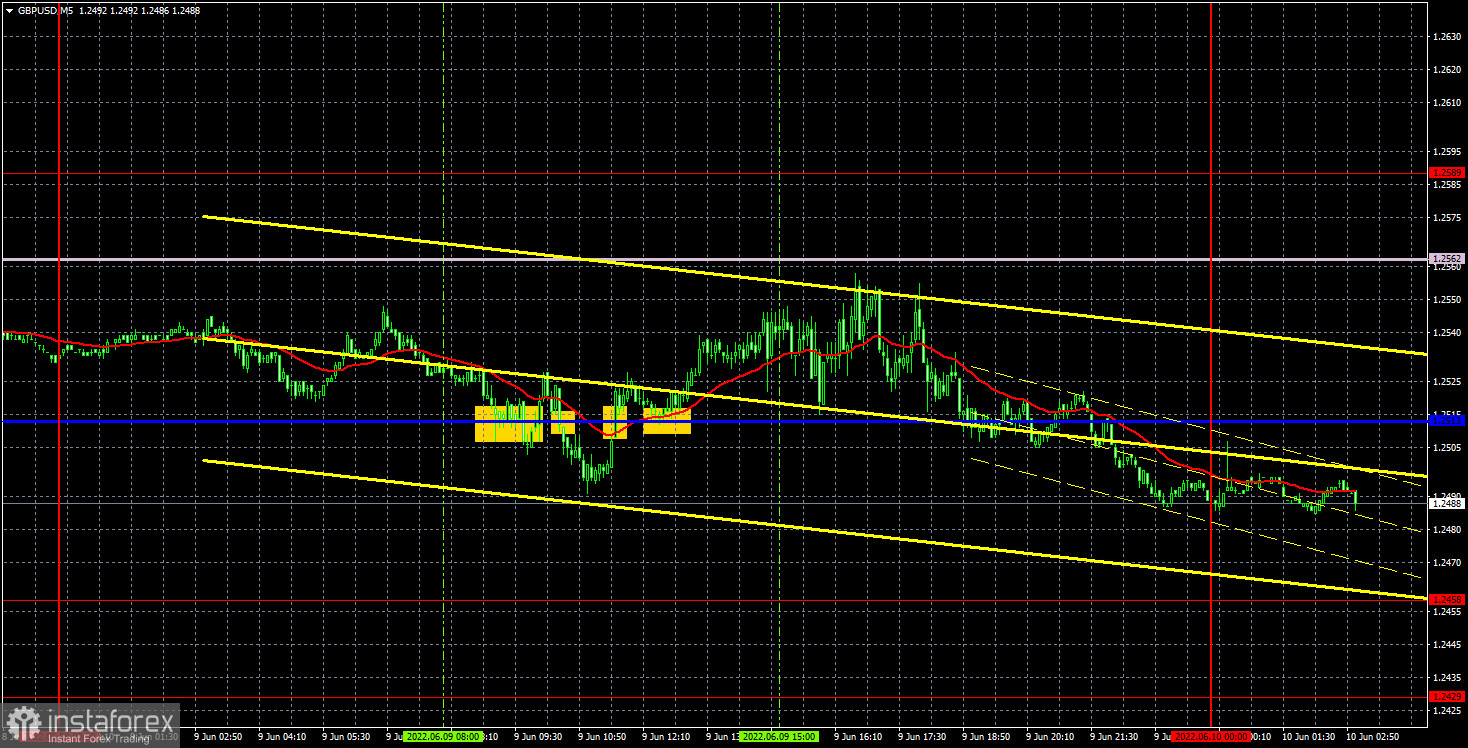
empty
10.06.2022 06:44 AM
Forecast and trading signals for GBP/USD for June 10. COT report. Detailed analysis of the pair's movement and trade deals. The British pound remains inside the horizontal channel

GBP/USD 5M

This image is no longer relevant

The GBP/USD currency pair did not show anything interesting on Thursday. An incomprehensible movement was observed all day, which is difficult to classify like a flat, but you can't call it a trend either. Traders ignored the Ichimoku indicator lines, which is not surprising, since we have a pronounced flat at the timeframe. Or a "swing." One way or another, but when the price moves mainly to the side, there is no need to talk about good movements or good signals. Moreover, not a single significant macroeconomic report was published during the day. Therefore, the volatility was low. Thus, it is not possible to make any high-profile conclusions. You need to wait for the pair to leave the horizontal channel or trade from its borders to the rebound.

There were few trading signals on Thursday, but they were all extremely inaccurate. This is also not surprising, since all of them were formed near the critical line, which is not a good source of trading signals in the flat, which we already talked about in past articles. As a result, all signals except the latter were false. It was possible to try only the first two, and even if you ignored our recommendations about being cautious when opening positions. Because even the first signal showed that the market does not know what to do with the pair. It is impossible to understand what it was: a rebound from the Kijun-Sen line or its breakthrough. Therefore, it was better to bypass this signal. The second signal for short positions led to a fall at 17 points, which was not enough to put Stop Loss to breakeven.
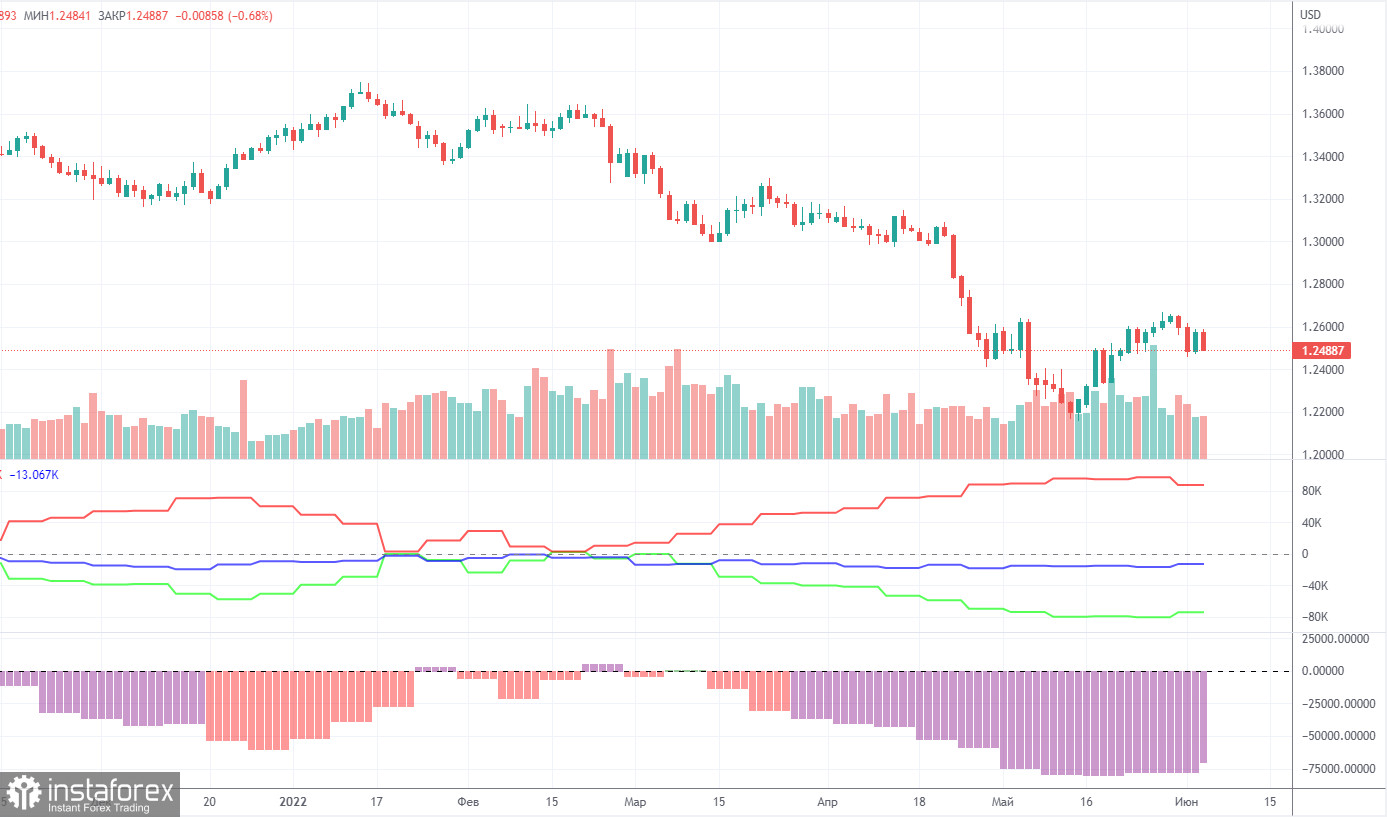
COT report:

This image is no longer relevant

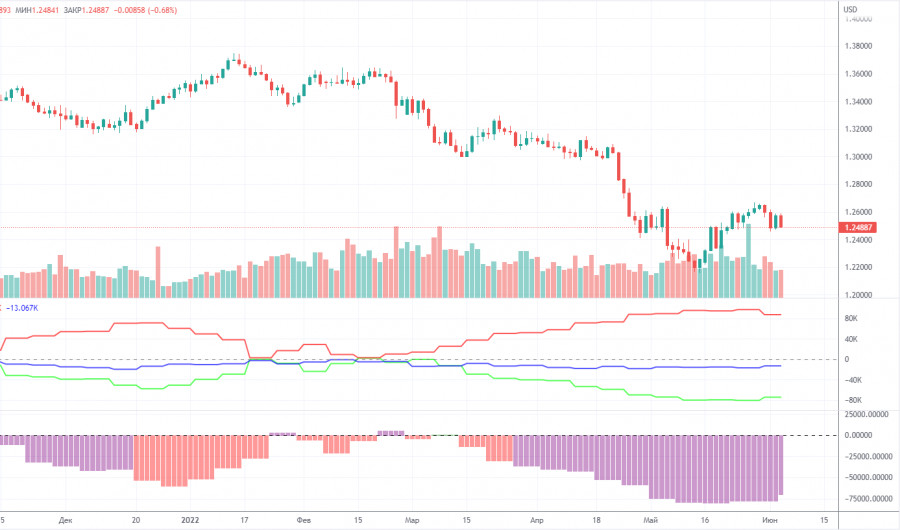
The latest Commitment of Traders (COT) report on the British pound showed minimal changes. During the week, the non-commercial group opened 4,800 long positions and closed 1,400 short positions. Thus, the net position of non-commercial traders increased by 6,200, for the first time in a long time. The net position has been falling for three months, which is perfectly visualized by the green line of the first indicator in the chart above or the histogram of the second indicator. Therefore, one increase in this indicator is unlikely to unambiguously indicate the end of the downward trend for the pound. The non-commercial group has already opened a total of 105,000 shorts and only 31,000 longs. Thus, the difference between these numbers is already more than three times. This means that the mood among professional traders now remains "pronounced bearish". We note that in the case of the pound, the COT data very accurately reflects what is happening in the market: the mood of traders is "very bearish", and the pound has been falling against the US dollar for a long time. In the past few weeks, the pound has shown growth, but even in the chart for this paragraph (daily timeframe), this movement looks very weak. Since in the case of the pound, the COT report reflects the real picture of things, we note that a strong divergence of the red and green lines of the first indicator often means the end of the trend. Therefore, formally now we can count on a new upward trend. However, weak geopolitical, fundamental and macroeconomic backgrounds for European currencies may again put pressure on them.

We recommend to familiarize yourself with:

Overview of the EUR/USD pair. June 10. Expected and predictable: The ECB did not raise the rate, but gave hope to traders.

Overview of the GBP/USD pair. June 10. The central banks of the world synchronously missed inflation and are now reaping the benefits.

Forecast and trading signals for EUR/USD on June 10. Detailed analysis of the movement of the pair and trading transactions.
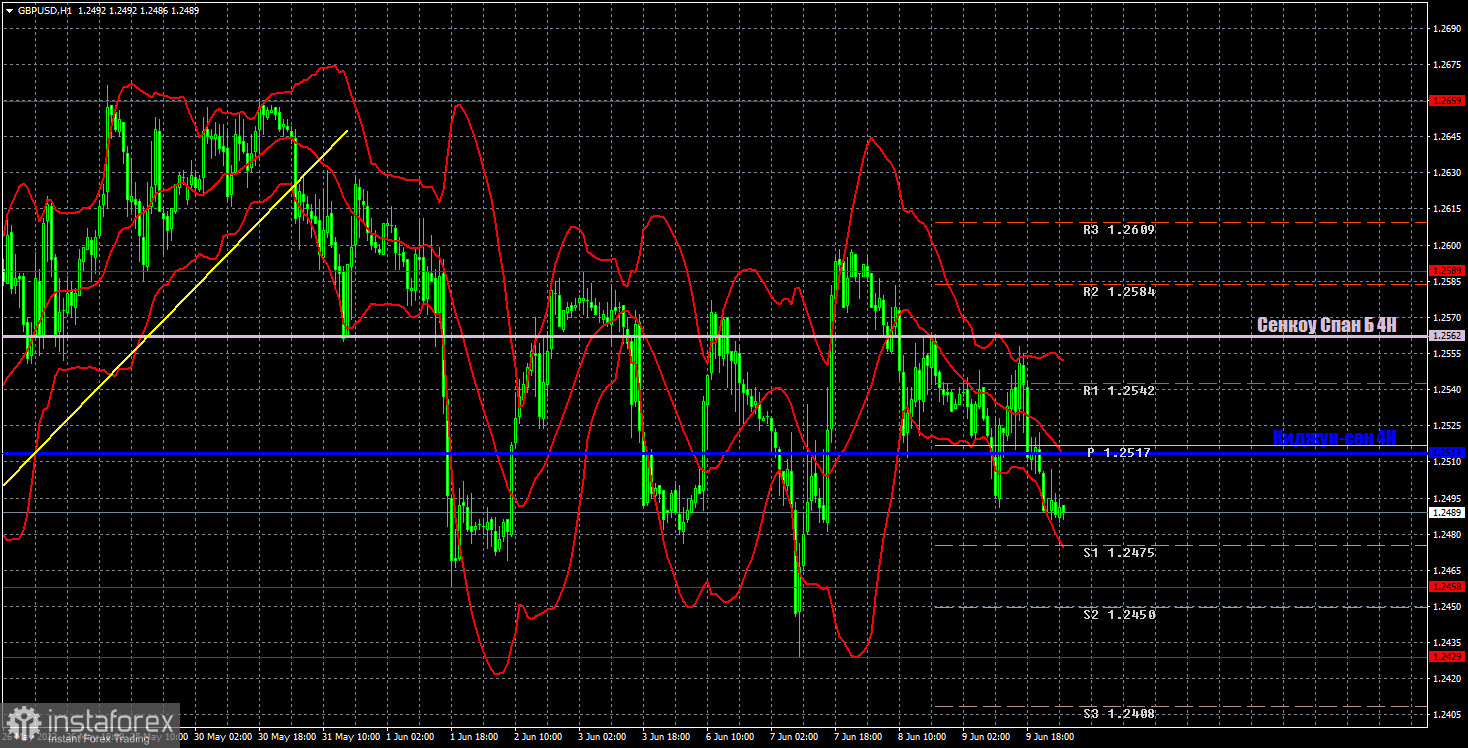
GBP/USD 1H

This image is no longer relevant

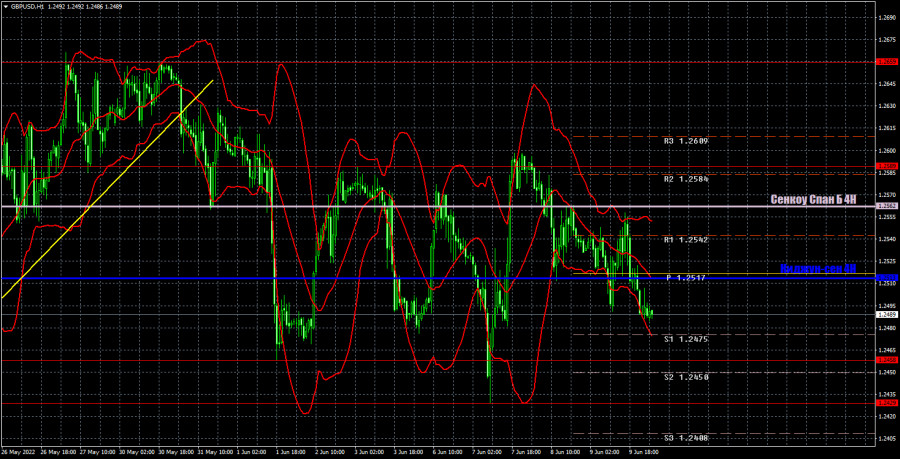
The pair is already definitely trading in the "swing" mode on the hourly timeframe, which leads to forming false signals, and the lines of the Ichimoku indicator lost their strength. Therefore, you should be very careful when opening any positions. It is best to work out the most accurate and strong signals - preferably for a rebound from levels of 1.2458 and 1.2589. Today, we distinguish the following important levels: 1.2259, 1.2429, 1.2458, 1.2589, 1.2659. Senkou Span B (1.2562) and Kijun-Sen (1.2513) can also be sources of signals. Signals can be "rebounds" and "breakthroughs" of these levels and lines. It is recommended to set the Stop Loss to breakeven when the price passes in the right direction by 20 points. The lines of the Ichimoku indicator can move during the day, which should be taken into account when determining trading signals. There are also support and resistance levels on the chart that can be used to take profits on transactions. Nothing interesting is planned for Friday in the UK. An inflation report will be released in America, but it will provoke a reaction from traders only if its actual value is very different from the forecast. We can see good volatility, but the pair will most likely remain inside the horizontal channel.

Explanations for the chart:

Support and Resistance Levels are the levels that serve as targets when buying or selling the pair. You can place Take Profit near these levels.

Kijun-sen and Senkou Span B lines are lines of the Ichimoku indicator transferred to the hourly timeframe from the 4-hour one.

Support and resistance areas are areas from which the price has repeatedly rebounded off.

Yellow lines are trend lines, trend channels and any other technical patterns.

Indicator 1 on the COT charts is the size of the net position of each category of traders.

Indicator 2 on the COT charts is the size of the net position for the non-commercial group.

Paolo Greco,
ผู้เชี่ยวชาญด้านการวิเคราะห์ของ InstaForex
© 2007-2025
เลือกช่วงเวลา
5
นาที
15
นาที
30
นาที
1
ชั่วโมง
4
ชั่วโมง
1
วัน
1
สัปดาห์
รับผลกำไรจากการเปลี่ยนแปลงอัตราสกุลเงินดิจิทัลกับ InstaForex.
ดาวน์โหลด MetaTrader 4 และเปิดการซื้อขายครั้งแรกของคุณ.
  • Grand Choice
    Contest by
    InstaForex
    InstaForex always strives to help you
    fulfill your biggest dreams.
    เข้าร่วมการแข่งขัน


บทความแนะนำ

วิธีการเทรดคู่เงิน GBP/USD ในวันที่ 17 มิถุนายน? เคล็ดลับง่ายๆ และการวิเคราะห์การซื้อขายสำหรับผู้เริ่มต้น

ในวันจันทร์ คู่เงิน GBP/USD ยังคงเคลื่อนไหวขึ้นอย่างต่อเนื่อง การทะลุเส้นแนวโน้มขาขึ้นที่เกิดอีกครั้งไม่นำไปสู่การเพิ่มค่าของเงินดอลลาร์สหรัฐ ซึ่งยังคงลดลงอย่างสม่ำเสมอและอ่อนค่าในระยะกลาง ในกรอบเวลารายชั่วโมง ขณะนี้มีเส้นแนวโน้มขาขึ้นใหม่ ราคาของคู่เงินนี้ได้มีการกระเด้งออกจากเส้นแนวโน้มนี้ถึงสามครั้งแล้ว และอาจจะกระเด้งครั้งที่สี่ได้ในวันนี้ ซึ่งอาจก่อให้เกิดการเคลื่อนไหวขาขึ้นใหม่ของเงินปอนด์อังกฤษ การลงไปต่ำกว่าเส้นแนวโน้มนี้จะไม่ได้มีน้ำหนักอะไรมากนักสำหรับเงินดอลลาร์ เพราะไม่ว่ารูปแบบทางเทคนิคใด ๆ ที่เกิดขึ้น

Paolo Greco 06:38 2025-06-17 UTC+2

การซื้อขายคู่สกุลเงิน EUR/USD ในวันที่ 17 มิถุนายน? เคล็ดลับง่ายๆ และการวิเคราะห์การซื้อขายสำหรับผู้เริ่มต้น

ในวันจันทร์ คู่สกุลเงิน EUR/USD ยังคงเคลื่อนไหวในทิศทางขาขึ้น ซึ่งเริ่มตั้งแต่ครึ่งหลังของวันศุกร์ อย่างไรก็ตาม ฝ่ายที่มองว่าราคาจะปรับเพิ่มขึ้นไม่สามารถเบรกผ่านระดับ 1.1609 เป็นครั้งที่สามได้ มันชัดเจนว่าค่าเงินยูโรได้ถึงจุดจำกัดเมื่อเทียบกับการอ่อนค่าของดอลลาร์สหรัฐแล้ว สำหรับการปรับตัวขึ้นที่จะดำเนินต่อไป ต้องการข้อมูลเชิงลบใหม่จากอีกฝั่งของแอตแลนติก และตรงไปตรงมา เราไม่สงสัยว่ามันจะมาถึงในไม่ช้า ด้วยการประชุมของ

Paolo Greco 06:38 2025-06-17 UTC+2

คำแนะนำและการวิเคราะห์การซื้อขายสำหรับ GBP/USD เมื่อวันที่ 17 มิถุนายน: ปอนด์ไม่ปล่อยให้โอกาสหลุดมือ

ในวันจันทร์ที่ผ่านมา คู่สกุลเงิน GBP/USD เคลื่อนไหวขึ้นตามที่คาดไว้ ในช่วงสัปดาห์ที่ผ่านมา การเคลื่อนไหวของคู่นี้ออกจะไปทางเส้นข้างมากกว่าจะเป็นกระแสขาขึ้น อย่างไรก็ตาม มันแทบไม่ได้ลดลงและยังคงอัปเดตระดับสูงสุดในรอบท้องถิ่นและสามปีอย่างต่อเนื่อง ดังนั้น สภาวะตลาดและรูปแบบการเคลื่อนไหวยังคงไม่เปลี่ยนแปลงอย่างมีนัยสำคัญ ในวันจันทร์ ดอลลาร์ประสบกับการลดลงอีกครั้งเนื่องจากความตึงเครียดในตะวันออกกลาง ในอดีต ดอลลาร์ได้รับการสนับสนุนจากความมั่นใจอย่างแรงในตลาด เพราะมันมักถูกมองว่าเป็น

Paolo Greco 03:49 2025-06-17 UTC+2

คำแนะนำและการวิเคราะห์การซื้อขายสำหรับ EUR/USD ในวันที่ 17 มิถุนายน: ปัจจัยด้านภูมิรัฐศาสตร์มีบทบาท

คู่สกุลเงิน EUR/USD แสดงแรงเคลื่อนไหวขึ้นอย่างแข็งแกร่งในวันอังคาร ตามที่เราคาดการณ์ไว้ ไม่มีรายงานเศรษฐกิจมหภาค—หลักหรือย่อย—ที่ถูกเผยแพร่ในวันดังกล่าว ดังนั้นการลดลงล่าสุดของดอลลาร์สหรัฐฯ สามารถอธิบายได้ด้วยเหตุการณ์ที่เกิดขึ้นในช่วงสุดสัปดาห์เป็นหลัก ย้อนถึงเหตุการณ์ในวันศุกร์ที่อิสราเอลเปิดการโจมตีด้วยขีปนาวุธต่ออิหร่าน ซึ่งทำลายหรือสร้างความเสียหายอย่างหนักต่อสิ่งอำนวยความสะดวกทางทหารและนิวเคลียร์ ตลาดได้ตอบสนองต่อเหตุการณ์นี้ในวันศุกร์ แต่ในวันเสาร์ อิหร่านได้ตอบโต้ด้วยการโจมตีด้วยขีปนาวุธ และในวันจันทร์ การยิงจากทั้งสองฝ่ายยังคงเกิดขึ้น ตลาดต้องใช้เวลาในการรับมือกับการปะทุของสงครามที่เพิ่มขึ้นนี้ในวันจันทร์

Paolo Greco 03:49 2025-06-17 UTC+2

GBP/USD: แผนการซื้อขายสำหรับช่วงการซื้อขายในสหรัฐฯ วันที่ 16 มิถุนายน (การวิเคราะห์การซื้อขายในช่วงเช้า)

ในคำทำนายตอนเช้าของฉัน ฉันเน้นที่ระดับ 1.3568 และวางแผนการตัดสินใจเข้าตลาดโดยอิงจากระดับนี้ ลองดูที่กราฟ 5 นาทีและดูว่าเกิดอะไรขึ้น มีการเคลื่อนไหวขึ้นและการทดสอบลวงที่เกิดขึ้นที่ระดับนั้น นำไปสู่การเปิดคำสั่งขายสำหรับเงินปอนด์ แต่ไม่มีการเคลื่อนไหวลงที่มีนัยสำคัญ ภาพทางเทคนิคถูกแก้ไขอีกครั้งสำหรับครึ่งหลังของวัน การเปิดสถานะ Long บน GBP/USD

Miroslaw Bawulski 19:18 2025-06-16 UTC+2

EUR/USD: แผนการซื้อขายสำหรับช่วงเซสชั่นของสหรัฐอเมริกาในวันที่ 16 มิถุนายน (วิเคราะห์การซื้อขายในช่วงเช้า)

ในการพยากรณ์ช่วงเช้าของฉัน ฉันได้เน้นที่ระดับ 1.1566 และวางแผนที่จะตัดสินใจซื้อขายตามระดับนี้ ลองมาดูกราฟ 5 นาทีและวิเคราะห์สิ่งที่เกิดขึ้น กัน มีการเคลื่อนไหวขึ้นและเกิดการทะลุ แต่ไม่มีการทดสอบซ้ำ ทำให้ฉันไม่ได้ทำการซื้อขาย ทางเทคนิคของภาพได้ถูกปรับแก้สำหรับช่วงครึ่งหลังของวัน ข้อมูลแสดงให้เห็นถึงการลดลงของอัตราเงินเฟ้อในอิตาลี ซึ่งสนับสนุนยูโรในช่วงครึ่งแรกของวัน เนื่องจาก

Miroslaw Bawulski 19:14 2025-06-16 UTC+2

วิธีการเทรดคู่เงิน GBP/USD ในวันที่ 16 มิถุนายน? เคล็ดลับง่าย ๆ และการวิเคราะห์การเทรดสำหรับผู้เริ่มต้น

เมื่อวันศุกร์ คู่เงิน GBP/USD แสดงการเคลื่อนไหวเกือบเหมือนกับคู่เงิน EUR/USD เนื่องจากปัจจัยสำคัญมีความเหมือนกัน การโจมตีของอิสราเอลต่ออิหร่านในช่วงค่ำได้กระตุ้นให้ดอลลาร์แข็งค่าขึ้นอย่างมาก ซึ่งก็สิ้นสุดในเวลาไม่นานเนื่องจากเทรดเดอร์นึกถึงว่าภูมิรัฐศาสตร์ในตะวันออกกลางยังไม่ใช่เรื่องที่ตลาดให้ความสำคัญในขณะนี้ รายงานเพียงชิ้นเดียวได้แก่ดัชนีความเชื่อมั่นผู้บริโภคของมหาวิทยาลัยมิชิแกน แข็งแกร่งกว่าที่คาดการณ์ไว้อย่างมาก อย่างไรก็ตามมันก็ยังไม่สนับสนุนให้ดอลลาร์แข็งค่า โดนัลด์ ทรัมป์ กำลังกำเนิดความวุ่นวายทั่วโลกอีกครั้ง คราวนี้ในตะวันออกกลาง

Paolo Greco 07:07 2025-06-16 UTC+2

วิธีการเทรดคู่เงิน EUR/USD ในวันที่ 16 มิถุนายน? เคล็ดลับง่ายๆ และการวิเคราะห์การเทรดสำหรับผู้เริ่มต้น

คืนวันศุกร์ คู่สกุลเงิน EUR/USD มีการลดลงอย่างรวดเร็ว ตามมาด้วยการฟื้นตัวตลอดทั้งวัน ดังนั้นวันทั้งหมดสามารถแบ่งได้เป็นสองช่วง ในช่วงแรก ดอลลาร์แข็งค่าขึ้นอย่างมั่นคง (สิ่งที่หายากมากในปัจจุบัน) และหลังจากนั้นตลาดก็ได้สติกลับมาและตระหนักว่าเกิดอะไรขึ้น ปฏิกิริยาเริ่มแรกของตลาดต่อการโจมตีอันรุนแรงของอิสราเอลต่ออิหร่านค่อนข้างเป็นธรรมชาติ — แต่ไม่สำหรับเงื่อนไขในวันนี้ ในอดีต ดอลลาร์จะมีมูลค่าเพิ่มขึ้นเมื่อมีความตึงเครียดทางการเมืองเกิดขึ้นทั่วโลก

Paolo Greco 07:07 2025-06-16 UTC+2

คำแนะนำการซื้อขายและการวิเคราะห์สำหรับ GBP/USD ในวันที่ 16 มิถุนายน: ปอนด์ไม่รู้สึกถึงความต้านทานจากดอลลาร์

ในวันศุกร์ที่ผ่านมา, คู่สกุลเงิน GBP/USD ยังคงเคลื่อนที่ขึ้นอย่างต่อเนื่อง ถ้าต้องการที่จะดูภาพรวมที่ได้ผลมากที่สุดให้เราเปลี่ยนไปดูการเคลื่อนที่ในช่วงเวลารายวัน ที่นั่นเราจะพบกับการที่ผู้สนับสนุนกำลังสุดแรงที่เริ่มขึ้นในวันเดียวกับที่พระองค์ดอนัลด์ ทรัมป์ปฏิบัติราชการ ตั้งแต่วันนั้นคุณจะพบกับสัก2-3การปรับตัวที่เป็นเพียงเล็กน้อย นั่นก็คือ สกุลเงินปอนด์ได้อยู่ในขั้นตอนขยายที่มีการหยุดน้อยมาก อย่างไรก็ตามในช่วงเวลาที่น้อยลง การเคลื่อนที่ไม่ได้เป็นเส้นทางเดียว การปรับตัวเกิดขึ้นบ้าง บางครั้งคงที่หลายสัปดาห์ แต่ยังคงเป็นความจริงที่สำคัญว่า

Paolo Greco 04:53 2025-06-16 UTC+2

คำแนะนำการซื้อขายและการวิเคราะห์สำหรับ EUR/USD ในวันที่ 16 มิถุนายน: จะมีพายุใหม่มาในวันจันทร์หรือไม่?

ในวันจันทร์ที่ผ่านมา, คู่สกุลเงิน EUR/USD ได้เคลื่อนที่ไปในทางทั้งสอง ในตอนแรก, ยูโรลดต่ำอย่างรุนแรง (สำหรับผู้ที่ไม่ได้หลับ) ซึ่งการทำงานของอิสราเอลต่ออิหร่าน เป็นผลที่ทำให้เกิดการฟื้นตัวที่แข็งแกร่งพอสมควร ทำไมการฟื้นตัวควรจะเกิดขึ้นอย่างนี้เลย? ทำไมดอลลาร์ไม่ได้ทำให้ข้อมูลดยังต่ออีกล่ะ? ตลาดระบบด่วนที่จะทำให้ความจำที่ด้วยเรื่องง่าย ๆ นึง คือ

Paolo Greco 04:53 2025-06-16 UTC+2
หากไม่สะดวกคุยในตอนนี้
ระบุคำถามไว้ได้ใน แชท.
Widget callback
 

Dear visitor,

Your IP address shows that you are currently located in the USA. If you are a resident of the United States, you are prohibited from using the services of InstaFintech Group including online trading, online transfers, deposit/withdrawal of funds, etc.

If you think you are seeing this message by mistake and your location is not the US, kindly proceed to the website. Otherwise, you must leave the website in order to comply with government restrictions.

Why does your IP address show your location as the USA?

  • - you are using a VPN provided by a hosting company based in the United States;
  • - your IP does not have proper WHOIS records;
  • - an error occurred in the WHOIS geolocation database.

Please confirm whether you are a US resident or not by clicking the relevant button below. If you choose the wrong option, being a US resident, you will not be able to open an account with InstaForex anyway.

We are sorry for any inconvenience caused by this message.