empty
08.02.2023 08:17 PM
Technical analysis of EUR/USD for February 08, 2023

This image is no longer relevant

Overview:

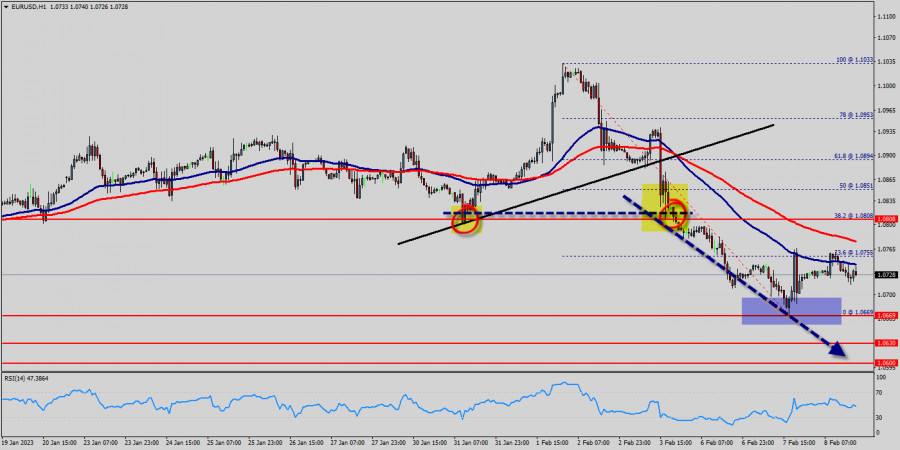
The EUR/USD pair has faced strong resistances at the levels of 1.0880 because support had become resistance last week. So, the strong resistance has been already formed at the level of 1.0880 and the pair is likely to try to approach it in order to test it again. However, if the pair fails to pass through the level of 1.0880, the market will indicate a bearish opportunity below the new strong resistance level of 1.0880 (the level of 1.0880 coincides with a ratio of 38.2% Fibonacci - last bullish wave - double top).

Moreover, the RSI starts signaling a downward trend, as the trend is still showing strength above the moving average (100) and (50). The trend of EUR/USD pair movement was controversial as it took place in the downtrend channel.

Due to the previous events, the price is still set between the levels of 1.0808 and 1.0669, so it is recommended to be careful while making deals in these levels because the prices of 1.0808 and 1.0669 are representing the resistance and support respectively.

Therefore, it is necessary to wait till the downtrend channel is passed through. Then the market will probably show the signs of a bearish market.

It should be noted that the volatility is very high for that the price of the EUR/USD pair is still trading between the prices of 1.0669 and 1.0808 in the coming hours.

Furthermore, the price has been set below the strong resistance at the levels of 1.0808 and 1.0851 which coincide with the 38.2% and 50% Fibonacci retracement levels respectively.

Thus, the market is indicating a bearish opportunity below 1.0808 so it will be good to sell at 1.0808 with the first target of 1.0669.

It will also call for a downtrend in order to continue towards 1.0630. The daily strong support is seen at 1.0600.

However, the stop loss should always be taken into account, for that it will be reasonable to set your stop loss at the level of 1.0851.

Moving averages, in the meantime, maintain their bearish slope way above the current level. Furthermore, although the news is bearish for the EUR/USD pair, professional may not want to sell weakness, but rather following a rebound rally.

Additionally, some aggressive counter-trend buyers may be defending parity. In case a continuousion takes place and the EUR/USD pair breaks through the support level of 1.0669 , a further decline to 1.0600 can occur which would indicate a bearish market.

Signal :

It should be noted that the 1.0808 price will act as a major resistance on Feb. 08th, 2023. Therefore, it will be too gainful to sell short below 1.0808 and look for further downside with 1.0669, 1.0630 and 1.0600 targets. It should also be reminded that stop loss must never exceed the maximum exposure amounts. Thus, stop loss should be placed at the 1.0851 level today.

Summary
Urgency
Analytic
Mourad El Keddani
Start trade
รับผลกำไรจากการเปลี่ยนแปลงอัตราสกุลเงินดิจิทัลกับ InstaForex.
ดาวน์โหลด MetaTrader 4 และเปิดการซื้อขายครั้งแรกของคุณ.
  • Grand Choice
    Contest by
    InstaForex
    InstaForex always strives to help you
    fulfill your biggest dreams.
    เข้าร่วมการแข่งขัน


บทความแนะนำ

การคาดการณ์สำหรับคู่เงิน EUR/USD วันที่ 27 สิงหาคม 2025

ในวันอังคาร คู่สกุลเงิน EUR/USD มีการเคลื่อนไหวด้านข้างโดยไม่สนใจระดับ 1.1637–1.1645 ซึ่งการเคลื่อนไหวด้านข้างอาจดำเนินต่อไปในวันนี้ เนื่องจากไม่มีข่าวสำคัญในช่วงระหว่างวัน การดีดตัวจากระดับการย้อนกลับ 50.0% ที่ 1.1590 อาจช่วยส่งเสริมให้เงินยูโรกลับมามีการเติบโตเพิ่มขึ้นไปสู่ระดับ Fibonacci 76.4% ที่

Samir Klishi 10:47 2025-08-27 UTC+2

การคาดการณ์สำหรับ GBP/USD ณ วันที่ 27 สิงหาคม 2025

ในกราฟรายชั่วโมง คู่เงิน GBP/USD ในวันอังคารได้ปรับขึ้นไปถึงระดับการปรับฐาน 76.4% ที่ 1.3482 แล้วคืนตัวและเปลี่ยนไปเป็นทางสกุลเงินสหรัฐฯ ดังนั้น แนวโน้มที่ลดลงอาจดำเนินต่อไปยังโซนสนับสนุนที่ 1.3416–1.3425 การคืนตัวจากโซนนี้จะสนับสนุนค่าเงินปอนด์บริติชและส่งผลให้มีการเติบโตบางส่วนไปที่ 1.3482 การสร้างฐานเหนือ 1.3482

Samir Klishi 10:43 2025-08-27 UTC+2

GBP/USD. การวิเคราะห์ดัชนีเมื่อวันที่ 27 สิงหาคม 2025

การวิเคราะห์แนวโน้ม (รูปที่ 1). ในวันพุธ ตลาดจากระดับ 1.3475 (ราคาปิดของกราฟแท่งเทียนรายวันเมื่อวานนี้) อาจเริ่มเคลื่อนตัวลง โดยมีเป้าหมายที่ 1.3405 – ระดับแนวรับทางประวัติศาสตร์ (เส้นประสีน้ำเงิน) หลังจากการทดสอบระดับนี้ ราคาอาจกลับตัวขึ้น

Stefan Doll 10:17 2025-08-27 UTC+2

EUR/USD: การวิเคราะห์ด้วยอินดิเคเตอร์ ณ วันที่ 27 สิงหาคม 2025

การวิเคราะห์แนวโน้ม (รูปที่ 1) ในวันพุธ ตลาดอาจเริ่มเคลื่อนไหวลงจากระดับ 1.1641 (จุดปิดของแท่งเทียนรายวันเมื่อวานนี้) โดยมีเป้าหมายที่ 1.1594 ซึ่งเป็นระดับ 50% Retracement (เส้นประสีเหลือง) เมื่อทดสอบระดับนี้แล้ว ราคาอาจดีดกลับขึ้นไปยังเป้าหมายที่

Stefan Doll 10:08 2025-08-27 UTC+2

AUD/JPY มีแนวโน้มที่จะยังคงเป็นขาขึ้นต่อไปในวันนี้ วันพุธที่ 27 สิงหาคม 2025

[AUD/JPY] – [วันพุธที่ 27 สิงหาคม 2025] ตำแหน่งของ EMA (50) เหนือ EMA (200) และ RSI ในโซน

Arief Makmur 06:32 2025-08-27 UTC+2

USDX กำลังพยายามทดสอบระดับแนวต้านที่ใกล้ที่สุด วันพุธที่ 27 สิงหาคม 2025

[ดัชนี USD] – [วันพุธที่ 27 สิงหาคม 2025] ด้วย EMA สองเส้นที่กำลังเกิด Golden Cross และ RSI อยู่ในโซน

Arief Makmur 06:32 2025-08-27 UTC+2

สัญญาณการซื้อขายสำหรับ BITCOIN ในวันที่ 27-30 สิงหาคม 2025: ขายต่ำกว่า $112,500 (4/8 Murray - 21 SMA)

หาก Bitcoin สามารถทะลุและยืนอยู่เหนือระดับ $112,500 ได้ นี่อาจถูกมองว่าเป็นช่วงตลาดขาขึ้นใหม่ และ Bitcoin อาจไต่ขึ้นไปถึงเส้นค่าเฉลี่ยเคลื่อนที่ 200 EMA ประมาณ $115,000 และระดับ 5/8

Dimitrios Zappas 06:24 2025-08-27 UTC+2

สัญญาณการซื้อขายสำหรับทองคำในวันที่ 27-30 สิงหาคม 2025: ขายต่ำกว่า $3,400 (200 EMA - 6/8 Murray)

ราคาทองคำกำลังซื้อขายอยู่ที่ประมาณ 3,388 เนื่องจากมีการปรับฐานทางเทคนิคน้อย. ในช่วงเปิดตลาดเช้าวันพุธ ราคาทองคำขึ้นไปถึง 3,393 หลังจากนั้นมีแนวโน้มว่าจะเกิดการปรับฐานทางเทคนิคจากจุดนั้น เราได้สังเกตเห็นว่าตลาดอยู่ในภาวะซื้อมากเกินไปและมีสัญญาณการอ่อนแรง. ตามทฤษฎีแล้ว ราคาทองคำอาจขึ้นไปถึงระดับ 6/8 Murray ประมาณ 3,398 อย่างไรก็ตาม

Dimitrios Zappas 06:23 2025-08-27 UTC+2

สัญญาณการซื้อขายสำหรับ EUR/USD ระหว่างวันที่ 27-30 สิงหาคม 2025: ขายต่ำกว่า 1.1660 (200 EMA - 7/8 Murray)

ในช่วงตลาดยุโรปตอนต้น สกุลเงินยูโรมีการซื้อขายที่ระดับ 1.1636 ภายใต้แรงกดดันขาลงและก่อตัวเป็นรูปแบบ inverted pennant หากมีการยืนยันรูปแบบนี้ EUR/USD อาจร่วงลงไปที่ 5/8 Murray ที่ระดับ 1.1535 และอาจถึงระดับ 4/8

Dimitrios Zappas 06:21 2025-08-27 UTC+2

การพยากรณ์ EUR/USD สำหรับวันที่ 27 สิงหาคม 2025

เมื่อวานนี้ ค่าเงินยูโรใช้เวลาทั้งวันในการเตรียมตัวเพื่อรวมฐานใต้ระดับแนวรับที่ 1.1632 (หากเกิดสถานการณ์ตลาดหมีหลักขึ้น) ในแท่งเทียนวันล่าสุด เงาบนได้แทรกทะลุเส้นตัวชี้วัดสมดุลเล็กน้อย ขณะที่ Marlin oscillator ยังคงอยู่ในแดนลบ ความรู้สึกขาลงในทิศทางราคายังคงอยู่ ตอนนี้ ราคาจำเป็นต้องทะลุจุดต่ำสุดของเมื่อวานที่ 1.1603 เพื่อเปิดทางไปยังเป้าหมายต่อไปที่

Laurie Bailey 04:53 2025-08-27 UTC+2
หากไม่สะดวกคุยในตอนนี้
ระบุคำถามไว้ได้ใน แชท.
Widget callback
 

Dear visitor,

Your IP address shows that you are currently located in the USA. If you are a resident of the United States, you are prohibited from using the services of InstaFintech Group including online trading, online transfers, deposit/withdrawal of funds, etc.

If you think you are seeing this message by mistake and your location is not the US, kindly proceed to the website. Otherwise, you must leave the website in order to comply with government restrictions.

Why does your IP address show your location as the USA?

  • - you are using a VPN provided by a hosting company based in the United States;
  • - your IP does not have proper WHOIS records;
  • - an error occurred in the WHOIS geolocation database.

Please confirm whether you are a US resident or not by clicking the relevant button below. If you choose the wrong option, being a US resident, you will not be able to open an account with InstaForex anyway.

We are sorry for any inconvenience caused by this message.