empty
26.06.2020 06:52 PM
Comprehensive analysis of movement options for #USDX vs EUR/USD & GBP/USD & USD/JPY (H4) on June 29, 2020

Minute operational scale (H4)

The end of June, the beginning of July - what's next? Development options for the movement of #USDX vs EUR/USD & GBP/USD & USD/JPY (H4) on June 29, 2020.

____________________

US dollar index

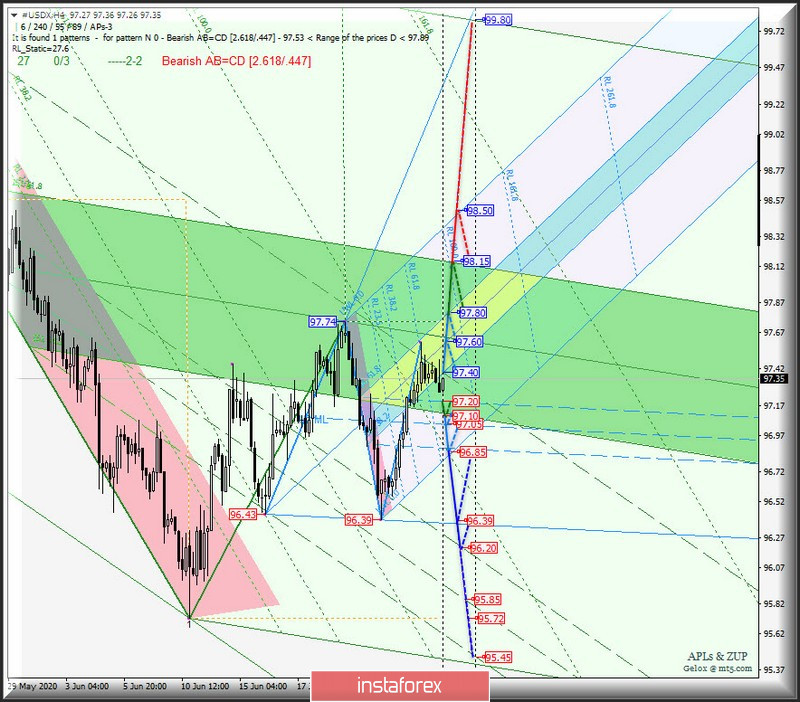
From June 29, 2020, the movement of the dollar index #USDX will be determined by the development and direction of the breakdown of the range:

  • resistance level of 97.40 - the lower limit of ISL38.2 of the balance zone of the Minuette operational scale forks;
  • support level of 97.20 - upper limit of the channel 1/2 Median Line Minuette.

In the breakdown of support level of 97.20, the movement of the dollar index will arise in the channel 1/2 Median Line (97.20-97.05-96.85) of the Minuette operational scale fork, and if there's a breakout of the lower border (96.85) of this channel, the downward movement of the tool can be extended to a local minimum 96.39 and the channel 1/2 Median Line (96.20-95.85-95.45) of the Minute operational scale fork.

With the breakdown of ISL38.2 Minuette - resistance level of 97.40, the #USDX movement will continue in the equilibrium zone (97.40-97.60-97.80) of the Minuette operational scale forks. In the case of breakdown ISL61.8 Minuette (97.80), then the dollar index can continue to move to the upper border ISL61.8 (98.15) of the equilibrium zone of the Minute operational scale forks and the final line FSL Minuette (98.50).

The markup of #USDX motion options since June 29, 2020 is shown on the animated chart.

This image is no longer relevant

____________________

Euro vs US dollar

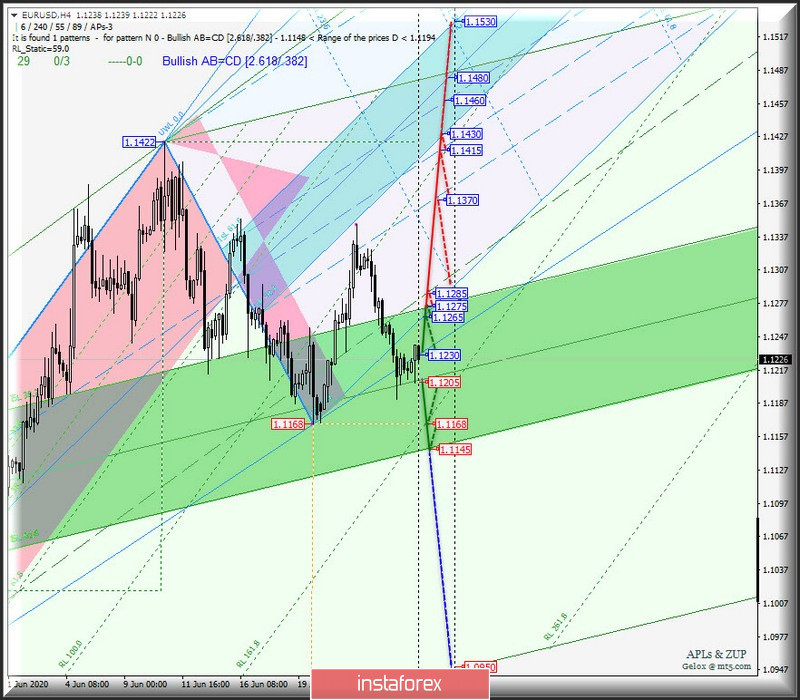
The development of the movement of the single European currency EUR/USD from June 29, 2020 will continue in the equilibrium zone (1.1275-1.1205-1.1145) of the Minute operational scale forks, taking into account the direction of the breakdown of the range:

  • resistance level of 1.1230 - control line LTL of the Minuette operational scale forks;
  • support level of 1.1205 - Median Line of the Minute operational scale forks.

When the LTL Minuette control line is broken - the resistance level of 1.1230 - then the movement of EUR/USD can be directed to the goals:

  • initial line SSL Minuette (1.1265);
  • upper bound of ISL 38. 2 (1.1275) equilibrium zone of the Minute operational scale forks;
  • ultimate Shiff Line Minute (1.1285);
  • with the prospect of reaching the boundaries of the 1/2 Median Line channel (1.1370-1.1415-1.1460) and equilibrium zones (1.1430-1.1480-1.1530) of the Minuette operational scale forks.

In the case of a breakdown of the support level of 1.1205 on the Median line Minute, the downward movement of the single European currency can be directed to the local minimum of 1.168 and the lower border of ISL61.8 (1.145) of the Minute operational scale forks.

The EUR/USD movement options from June 29, 2020 are shown on the animated chart.

This image is no longer relevant

____________________

Great Britain pound vs US dollar

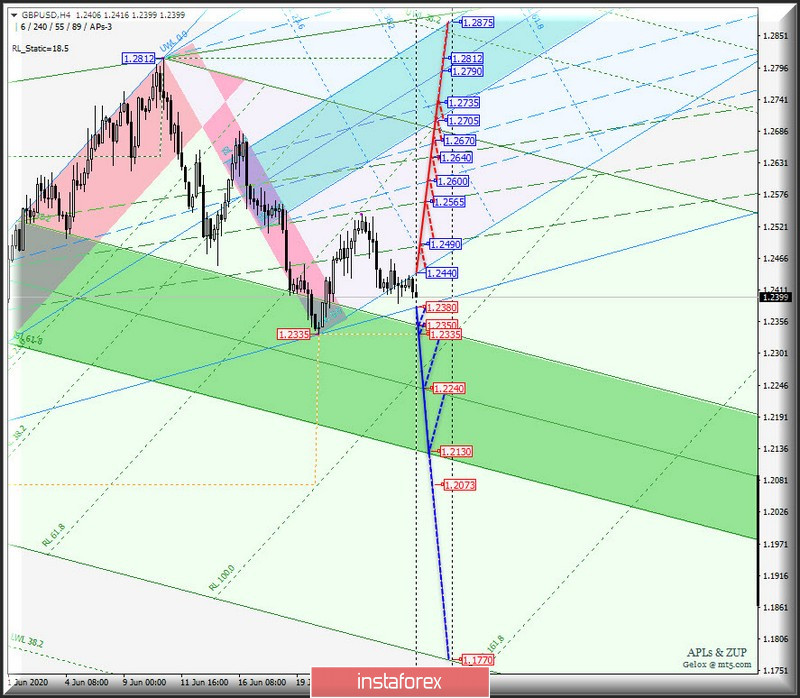
The development of the movement of Her Majesty's currency GBP/USD from June 29, 2020 will be determined by the development and direction of the breakdown of the range:

  • resistance level of 1.2440 - initial line of SSL of the Minuette operational scale forks;
  • support level of 1.2380 - control line LTL of the Minuette operational scale forks.

If the resistance level of 1.2440 on the starting line SSL of the Minuette operational scale forks will make it possible to achieve the currency of Her Majesty's borders of channels 1/2 Median Line of the Minute operational scale forks (1.2490-1.2565-1.2640) and Minette (1.2600-1.2670-1.2735).

Breakdown of the support level of 1.2380 at the control line LTL of the Minute operational scale forks with subsequent breakdown ISL38.2 Minute (1.2350) and update local minimum of 1.2335 will determine the further development of the movement of GBP/USD in the zone of equilibrium (1.2350-1.2240-1.2130) of the Minute operational scale forks.

From June 29, 2020, we look at the GBP/USD movement options on the animated chart.

This image is no longer relevant

____________________

US dollar vs Japanese yen

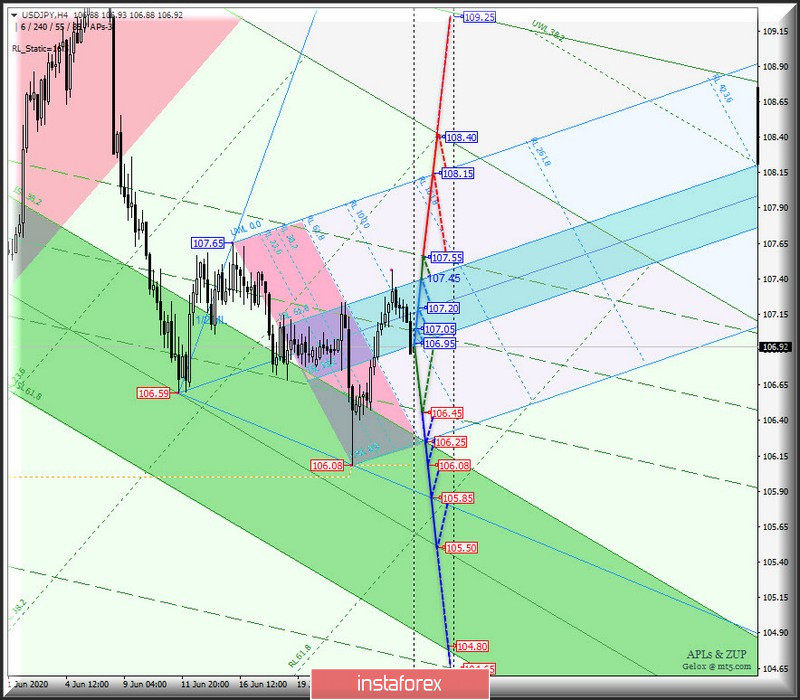
From June 29, 2020, the development of the USD/JPY currency movement of the "Land of the Rising Sun" will continue in the 1/2 Median Line channel (107.55-107.05-106.45) of the Minute operational scale forks, taking into account the development of the boundaries of the equilibrium zone (107.45-107.20-106.95) of the Minuette operational scale forks - the marking of movement within the 1/2ML Minute channel is shown on the animated chart.

If the support level of 106.45 breaks at the lower border of the channel 1/2 Median Line Minute, it will be possible for the currency of the "Land of the Rising Sun" to reach the boundaries of the equilibrium zone (106.25 - 105.50 - 104.80) of the Minute operational scale forks.

The breakdown of the resistance level of 107.55 on the upper border of the channel 1/2 Median Line of the Minute operational scale forks upward movement in the USD/JPY will be allocated to the target line FSL (108.15) of the Minuette operational scale forks and the initial line SSL (108.40) trading recommendations.

The markup of the USD/JPY movement options from June 29, 2020 is shown on the animated chart.

This image is no longer relevant

____________________

The review is compiled without taking into account the news background, the opening of trading sessions of the main financial centers and is not a guide to action (placing "sell" or "buy"orders).

Formula for calculating the dollar index:

USDX = 50.14348112 * USDEUR0.576 * USDJPY0.136 * USDGBP0.119 * USDCAD0.091 * USDSEK0.042 * USDCHF0.036.

where the power coefficients correspond to the weights of currencies in the basket:

Euro - 57.6 %;

Yen - 13.6 %;

Pound sterling - 11.9 %;

Canadian dollar - 9.1 %;

Swedish Krona - 4.2 %;

Swiss franc-3.6 %.

The first coefficient in the formula brings the index value to 100 on the starting date - March 1973, when the main currencies began to be freely quoted relative to each other.

Ratu Taslim,
ผู้เชี่ยวชาญด้านการวิเคราะห์ของ InstaForex
© 2007-2025
เลือกช่วงเวลา
5
นาที
15
นาที
30
นาที
1
ชั่วโมง
4
ชั่วโมง
1
วัน
1
สัปดาห์
รับผลกำไรจากการเปลี่ยนแปลงอัตราสกุลเงินดิจิทัลกับ InstaForex.
ดาวน์โหลด MetaTrader 4 และเปิดการซื้อขายครั้งแรกของคุณ.
USD/JPY: การวิเคราะห์และการคาดการณ์ ในช่วงการซื้อขายยุโรปของวันพฤหัสบดี เงินเยนญี่ปุ่นคงความเสถียร และทำให้คู่เงิน USD/JPY สามารถยืนอยู่เหนือระดับที่สำคัญ 143.00 ได้ท่ามกลางการเพิ่มขึ้นอย่างพอสมควรของเงินดอลลาร์สหรัฐ นักลงทุนมั่นใจว่าธนาคารแห่งประเทศญี่ปุ่นจะยังคงปรับขึ้นอัตราดอกเบี้ยต่อไปเพื่อตอบสนองต่ออัตราเงินเฟ้อที่สูงขึ้น ซึ่งกำลังทำให้ค่าจ้างที่แท้จริงลดลงในญี่ปุ่นเป็นเดือนที่สี่ติดต่อกัน ปัจจัยเหล่านี้ รวมถึงความไม่แน่นอนทางการค้าและความเสี่ยงทางภูมิรัฐศาสตร์ที่เพิ่มขึ้น กำลังจำกัดการสูญเสียของสกุลเงินญี่ปุ่นซึ่งเป็นที่พักพิงปลอดภัยในภูมิภาคตะวันออกไกล ในเวลาเดียวกัน ธนาคารแห่งประเทศญี่ปุ่นมีแนวโน้มการเงินที่เข้มงวดซึ่งขัดแย้งอย่างมากกับการคาดการณ์ของ Federal
  • Grand Choice
    Contest by
    InstaForex
    InstaForex always strives to help you
    fulfill your biggest dreams.
    เข้าร่วมการแข่งขัน


บทความแนะนำ

NZD/USD: การวิเคราะห์และคาดการณ์

วันนี้คู่เงิน NZD/USD ยังคงดึงดูดความสนใจจากผู้ซื้อ แม้ว่าจะยังคงต่ำกว่าระดับ 0.6050 ก็ตาม ออสซิลเลเตอร์ในทุกกรอบเวลายังคงอยู่ในแดนบวกและยังห่างไกลจากเขตซื้อมากเกินไป ยืนยันทิศทางเชิงบวกสำหรับคู่นี้ อย่างไรก็ตาม ควรรอโมเมนตัมการซื้อที่แข็งแกร่งเหนือแนวต้านที่ 0.6050 ก่อนที่จะเปิดสถานะซื้อใหม่ การเคลื่อนไหวขึ้นต่อมาจะยกคู่เงิน NZD/USD ไปสู่แนวต้านใกล้

Irina Yanina 12:03 2025-06-05 UTC+2

การพยากรณ์สำหรับ EUR/USD ในวันที่ 5 มิถุนายน 2025

เมื่อวันพุธ คู่สกุลเงิน EUR/USD ดีดตัวกลับจากโซนแนวรับ 1.1374–1.1380 และกลับตัวเป็นในทิศทางที่เป็นผลดีต่อยูโร การเคลื่อนไหวขาขึ้นใหม่ไปยังระดับการปรับฐาน 76.4% ที่ 1.1454 ได้เริ่มขึ้น การดีดตัวจากระดับนี้จะเป็นผลดีต่อดอลลาร์สหรัฐและอาจทำให้ราคาปรับลดลงเล็กน้อยกลับไปยังโซนแนวรับ 1.1374–1.1380 หากเกิดการเคลื่อนไหวเหนือระดับ 1.1454

Samir Klishi 11:22 2025-06-05 UTC+2

GBP/USD วันที่ 5 มิถุนายน: ตลาดแรงงานส่งสัญญาณเชิงลบ

บนกราฟรายชั่วโมง คู่เงิน GBP/USD ในวันพุธมีการยืนเหนือระดับ 161.8% retracement ที่ค่อนข้างอ่อนที่ 1.3520 การยืนเหนือระดับนี้เปิดโอกาสให้คาดการณ์ถึงการเติบโตต่อไปที่ระดับ retracement ถัดไปที่ 1.3620 ในทางตรงกันข้าม หากราคาลดลงต่ำกว่าระดับ 1.3520

Samir Klishi 11:14 2025-06-05 UTC+2

การวิเคราะห์ทางเทคนิคของการเคลื่อนไหวของราคาในวันซื้อขายภายในดัชนี Nasdaq 100, วันพฤหัสบดีที่ 5 มิถุนายน 2025

ด้วยสภาพของตัวบ่งชี้ Stochastic Oscillator ที่อยู่ที่ระดับ Overbought และมี Divergence ปรากฏขึ้นระหว่างตัวบ่งชี้กับการเคลื่อนไหวของราคาดัชนี Nasdaq 100 ทำให้ในอนาคตอันใกล้นี้มีโอกาสที่จะถูกปรับแก้ไปที่ระดับ 21178.2 อย่างไรก็ตาม ตราบใดที่การปรับแก้ที่ลดลงนั้นไม่ทำลายและปิดต่ำกว่าระดับ 20713.8

Arief Makmur 09:53 2025-06-05 UTC+2

สัญญาณการซื้อขายสำหรับ EUR/USD ระหว่างวันที่ 5-9 มิถุนายน 2025: ขายต่ำกว่า 1.1474 (21 SMA - 6/8 Murray)

คู่เงิน EUR/USD กำลังซื้อขายอยู่ประมาณ 1.1419 ในช่วงการซื้อขายของยุโรป แสดงให้เห็นการฟื้นตัวหลังจากที่ได้แตะระดับรองรับของ 5/8 Murray ประมาณ 1.1352 ระดับรองรับนี้ช่วยให้เงินยูโรดันขึ้นมาได้มาก แต่ขณะนี้เราพบสัญญาณของความอ่อนแรง หากทองยูโรยังคงเพิ่มขึ้น เราอาจคาดว่าจะพบการต่อต้านที่แข็งแกร่งของระดับ 6/8

Dimitrios Zappas 06:38 2025-06-05 UTC+2

สัญญาณการซื้อขายสำหรับทองคำ (XAU/USD) สำหรับวันที่ 5-9 มิถุนายน 2025: ขายเมื่อราคาต่ำกว่า $3,387 (21 SMA - 7/8 Murray)

ช่วงเช้าของการซื้อขายในยุโรป ทองคำอยู่ที่ระดับประมาณ 3,372 แสดงสัญญาณของการเหนื่อยล้าหลังจากที่ขึ้นไปถึงระดับสูงสุดประจำสัปดาห์ที่ 3,387 เราอาจคาดหวังว่าจะมีการปรับเทคนิคเกิดขึ้นในชั่วโมงถัดไป ไปสู่ 21SMA หรือ 7/8 Murray EMA ที่ 3,355 ถ้าแรงกดดันขาลงยังคงอยู่

Dimitrios Zappas 06:36 2025-06-05 UTC+2

การคาดการณ์ EUR/USD สำหรับวันที่ 5 มิถุนายน 2025

หลังจากที่ต้องเผชิญกับความยากลำบากมาเป็นเวลาสามวัน ยูโรได้ผ่านแนวต้านที่ระดับ 1.1420 ตอนนี้เป้าหมายที่ระดับ 1.1535 เปิดกว้าง ความสำเร็จในการผ่านระดับนี้จะช่วยให้การเพิ่มขึ้นของราคายังคงดำเนินต่อไปจนถึงระดับ 1.1692 ออสซิลเลเตอร์มาร์ลินซึ่งอยู่ในพื้นที่บวก ยังคงผลักดันราคาให้เพิ่มสูงขึ้น สัญญาณเช่นนี้ในวันที่คาดว่าธนาคารกลางยุโรปจะลดอัตราดอกเบี้ยนั้นน่ากังวล เราเชื่อว่าการปรับขึ้นที่ซับซ้อนของเงินยูโรตั้งแต่กลางเดือนพฤษภาคมนั้นได้คำนึงถึงการลดอัตราดอกเบี้ยนี้แล้ว โดยเฉพาะอย่างยิ่งเมื่อเราเปรียบเทียบกับการแสดงออกของเงินยูโรต่อสกุลเงินอื่นๆ ที่มีความแข็งแกร่งกว่า ผู้เข้าร่วมตลาดอาจพบสัญญาณความเหี้ยมหาญในความคิดเห็นจากเจ้าหน้าที่การเงิน

Laurie Bailey 04:55 2025-06-05 UTC+2

การคาดการณ์ GBP/USD สำหรับวันที่ 5 มิถุนายน 2025

ค่าเงินปอนด์ของอังกฤษกำลังเพิ่มขึ้นอย่างยากลำบากจนดูเหมือนใกล้จะละทิ้งแผนการที่จะไปถึง 1.3790 ซึ่งเป็นขอบด้านบนของช่องราคานี้แล้ว ออสซิลเลเตอร์ Marlin รายวันกำลังเอนไปทางขอบด้านล่างของช่องขึ้นนี้ ณ จุดนี้ เราไม่ได้พิจารณาความเป็นไปได้ของการปรับฐานอย่างลึก (เช่น ลงไปที่ 1.3208) แทนที่จะเป็นการยอมให้เกิดแนวโน้มด้านข้างต่อไปในช่วงของ 1.3433–1.3635 หากราคาขยับไปด้านข้าง

Laurie Bailey 04:55 2025-06-05 UTC+2

การทำนายราคาซิลเวอร์สำหรับวันที่ 5 มิถุนายน 2025

หลังจากการเคลื่อนไหวที่แข็งแกร่งเมื่อวันที่ 2 มิถุนายน ราคาได้สร้างรูปแบบสามเหลี่ยมขนาดเล็กในสองวันถัดไป โดยแท่งเทียนของเมื่อวานปิดที่ระดับเปิด นี่ถือเป็นการก่อตัวแบบต่อเนื่อง และในวันนี้ การเคลื่อนไหวได้เริ่มต้นในทิศทางขาขึ้น ออสซิลเลเตอร์ Marlin ลดลงเล็กน้อยเนื่องจากการรวมตัว แต่ยังคงมีศักยภาพในการเติบโตที่สำคัญ เป้าหมายราคาที่ใกล้ที่สุดคือ 35.67 ซึ่งเป็นจุดสูงสุดจากเดือนตุลาคม

Laurie Bailey 04:55 2025-06-05 UTC+2

GBP/JPY: การวิเคราะห์และการคาดการณ์

คู่เงิน GBP/JPY ยังคงมีโมเมนตัมเชิงบวกต่อเนื่องเป็นวันที่สอง จากมุมมองทางเทคนิค คู่เงิน GBP/JPY ได้แสดงความแข็งแกร่งอีกครั้งต่ำกว่าค่าเฉลี่ยการเคลื่อนที่อย่างง่าย 200 วัน ซึ่งการเคลื่อนไหวขึ้นด้านเหนือในครั้งนี้เป็นสิ่งที่สนับสนุนแนวโน้มตลาดขาขึ้น นอกจากนี้ การแกว่งตัวในแดนบวกบนกราฟรายวันยังบ่งชี้ว่าแนวโน้มราคาตลาดตามแนวโน้มปัจจุบันยังคงเป็นขาขึ้นดังนั้น มีโอกาสที่ราคาจะขึ้นไปสู่แนวต้านสำคัญถัดไปที่ระดับ 195.60 อย่างไรก็ตาม

Irina Yanina 14:05 2025-06-04 UTC+2
หากไม่สะดวกคุยในตอนนี้
ระบุคำถามไว้ได้ใน แชท.
Widget callback
 

Dear visitor,

Your IP address shows that you are currently located in the USA. If you are a resident of the United States, you are prohibited from using the services of InstaFintech Group including online trading, online transfers, deposit/withdrawal of funds, etc.

If you think you are seeing this message by mistake and your location is not the US, kindly proceed to the website. Otherwise, you must leave the website in order to comply with government restrictions.

Why does your IP address show your location as the USA?

  • - you are using a VPN provided by a hosting company based in the United States;
  • - your IP does not have proper WHOIS records;
  • - an error occurred in the WHOIS geolocation database.

Please confirm whether you are a US resident or not by clicking the relevant button below. If you choose the wrong option, being a US resident, you will not be able to open an account with InstaForex anyway.

We are sorry for any inconvenience caused by this message.