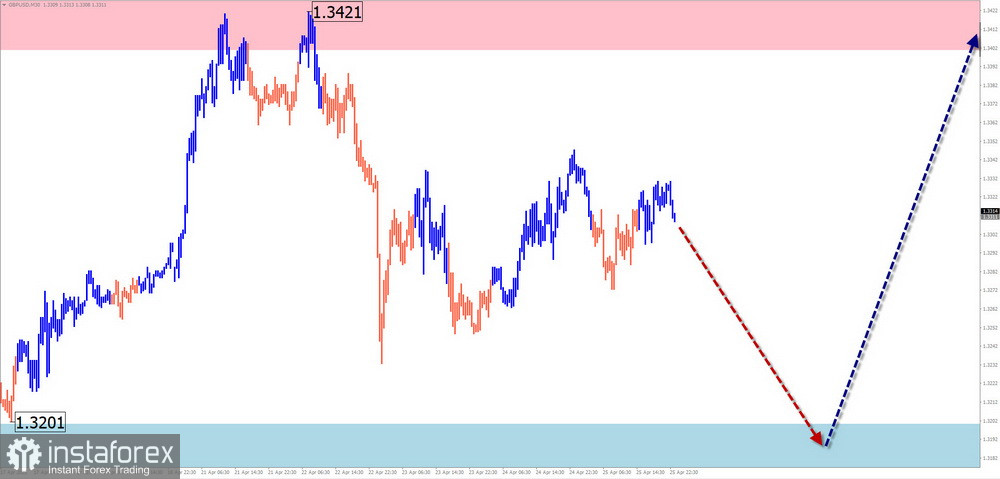
GBP/USD
Analysis:
Since the beginning of the year, the British pound has been predominantly moving in a bullish trend against the U.S. dollar. Wave structure analysis suggests this trend may continue for at least a few more weeks. The current unfinished section of the final part (C) is moving sideways, forming a pullback.
Forecast:
Expect a generally sideways movement for the British pound this week. A brief decline is possible early on. Volatility and a return to an upward trend are likely toward the weekend, possibly coinciding with major economic releases.
Potential Reversal Zones:
- Resistance: 1.3400/1.3450
- Support: 1.3200/1.3150
Recommendations:
- Sales: Risky due to low potential; may lead to losses.
- Purchases: Should become the primary trading direction after confirmed reversal signals near support.
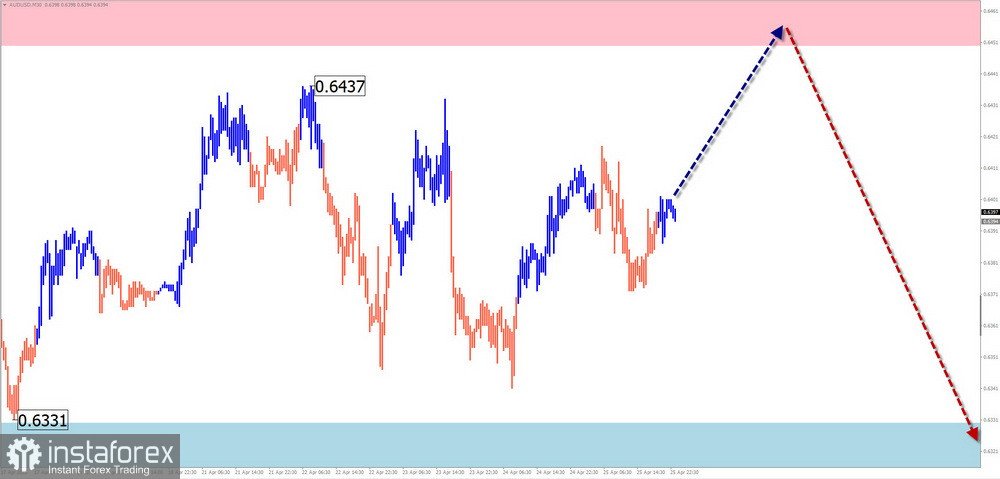
AUD/USD
Analysis:
Since April 7, the AUD/USD chart has been forming an upward wave with strong reversal potential. Its unfinished segment is currently moving sideways along the potential reversal zone. The wave level remains within the bounds of a correction.
Forecast:
Expect a generally sideways movement throughout the week. A brief pressure on the resistance zone may occur early on, followed by a reversal and decline toward the support area. Maximum volatility is likely toward the end of the week.
Potential Reversal Zones:
- Resistance: 0.6450/0.6500
- Support: 0.6330/0.6280
Recommendations:
- Purchases: Can be considered after confirmed reversal signals near support.
- Sales: Possible within intraday trading using small volumes; potential is limited by support.
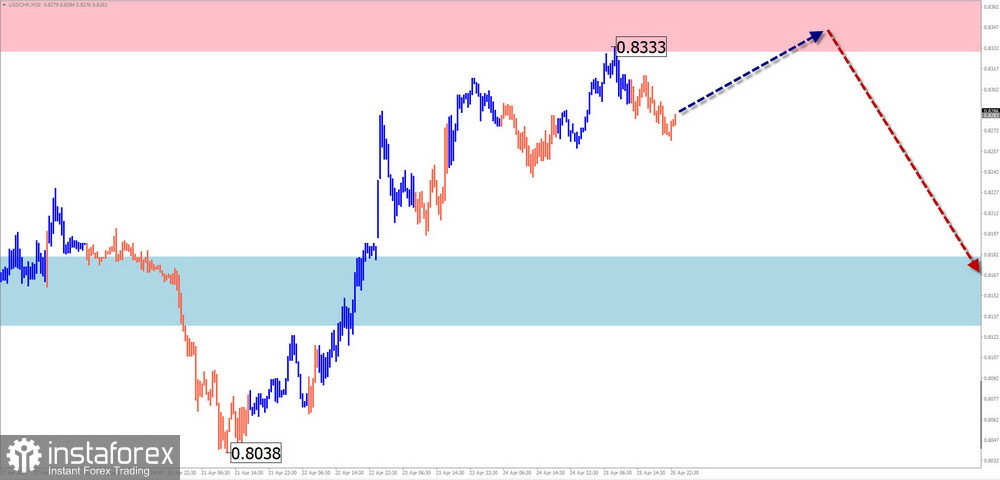
USD/CHF
Analysis:
Since the beginning of the year, USD/CHF has been guided by a downward trend. After months of active decline, the pair has reached the upper boundary of a strong weekly reversal zone. A corrective upward movement is forming along this area.
Forecast:
The first half of the week is likely to see the completion of the upward correction. After touching resistance, a reversal and new downward movement are expected. Peak volatility is likely by the weekend.
Potential Reversal Zones:
- Resistance: 0.8330/0.8380
- Support: 0.8180/0.8130
Recommendations:
- Sales: No conditions for such trades until confirmed reversal signals near resistance.
- Purchases: Possible with reduced volume size during individual sessions.
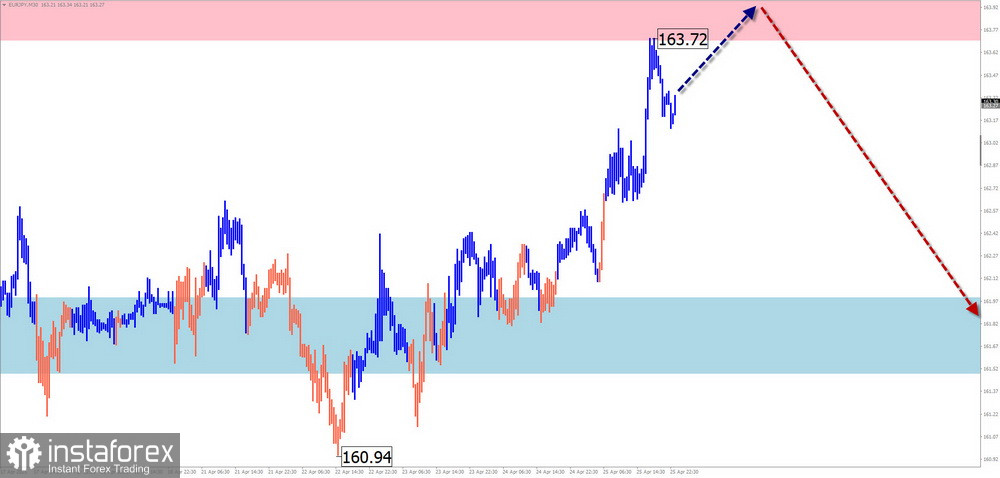
EUR/JPY
Analysis:
EUR/JPY remains in a sideways range in the short term. The ongoing ascending wave structure has been developing since April 7. The final part (C) of the wave is nearing the upper edge of a broad potential reversal zone.
Forecast:
The current bullish trend may end in the next couple of days. Some pressure on resistance is possible, followed by a transition into a sideways range and eventual reversal. Volatility may increase toward the second half of the week.
Potential Reversal Zones:
- Resistance: 163.70/164.20
- Support: 162.00/161.50
Recommendations:
- Purchases: High-risk, may lead to losses.
- Sales: Will become relevant after confirmed reversal signals on your trading systems.
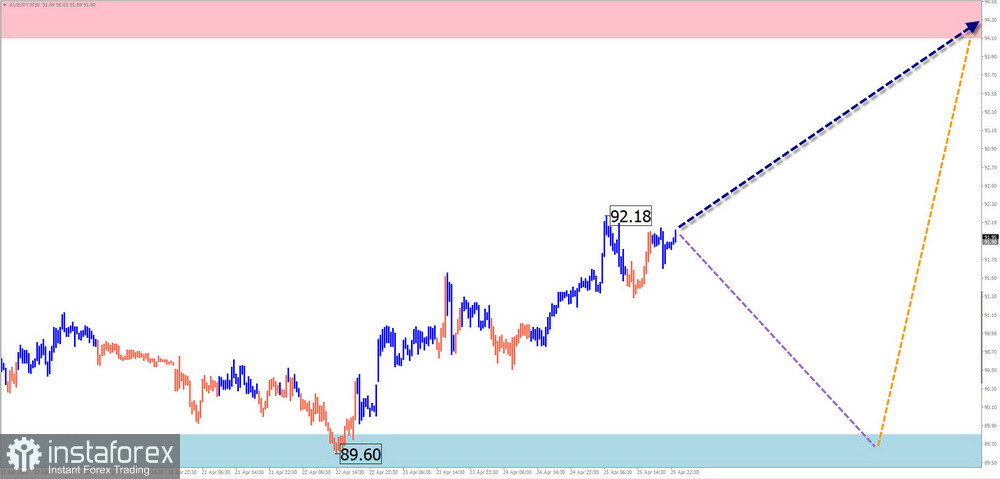
AUD/JPY
Analysis:
Since August last year, AUD/JPY has been forming an extended ascending flat pattern. The current unfinished bullish wave started on April 9 from a major reversal zone and holds strong reversal potential. If confirmed, the uptrend could become dominant.
Forecast:
An overall upward movement is expected this week. Early on, a brief sideways drift or decline toward support is possible. Peak volatility is likely by the end of the week.
Potential Reversal Zones:
- Resistance: 94.10/94.60
- Support: 89.80/89.30
Recommendations:
- Sales: No potential for the upcoming week.
- Purchases: May become the main trading direction upon confirmation of reversal signals.
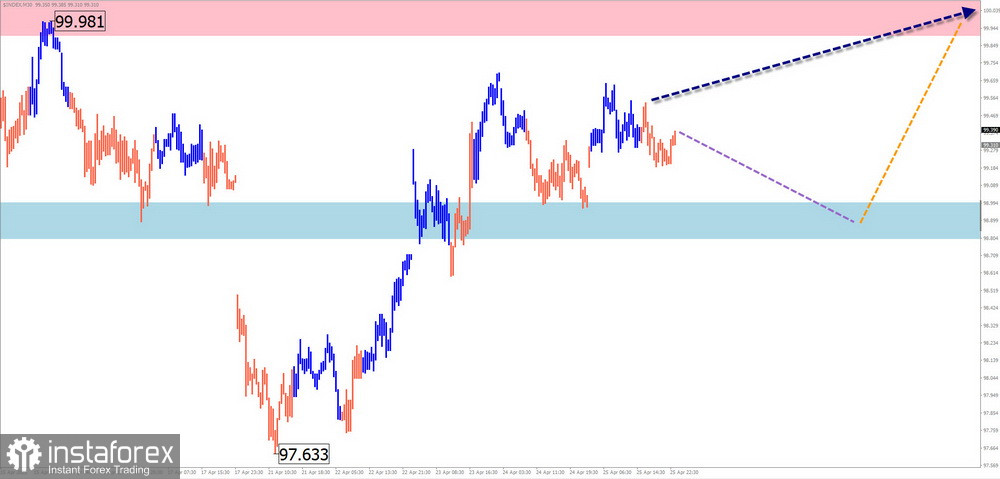
US Dollar Index
Brief Analysis:
The U.S. dollar remains in a downtrend that started in February. The index is nearing the upper boundary of a major weekly potential reversal zone. Over the past two weeks, the index has formed a corrective move, suggesting an extended flat structure.
Weekly Forecast:
Expect continued movement within the outlined zones. Early in the week, the dollar may decline toward the support zone, followed by a shift to sideways movement and preparation for a reversal. A renewed upward trend in the index is possible later in the week.
Potential Reversal Zones:
- Resistance: 99.90/100.10
- Support: 99.00/98.80
Recommendations:
- No clear conditions for buying major currencies against the dollar in the near term.
- Likewise, do not expect a strong and lasting recovery of the dollar. Trends could change significantly in the coming weeks.
Notes: In Simplified Wave Analysis (SWA), all waves consist of three parts (A-B-C). Each timeframe analyzes only the latest unfinished wave. Dashed lines represent expected price paths.
Warning: The wave algorithm does not account for the time duration of market movements!