empty
01.11.2023 06:45 AM
EUR/USD and GBP/USD: Technical analysis for November 1

EUR/USD

This image is no longer relevant

Higher Timeframes

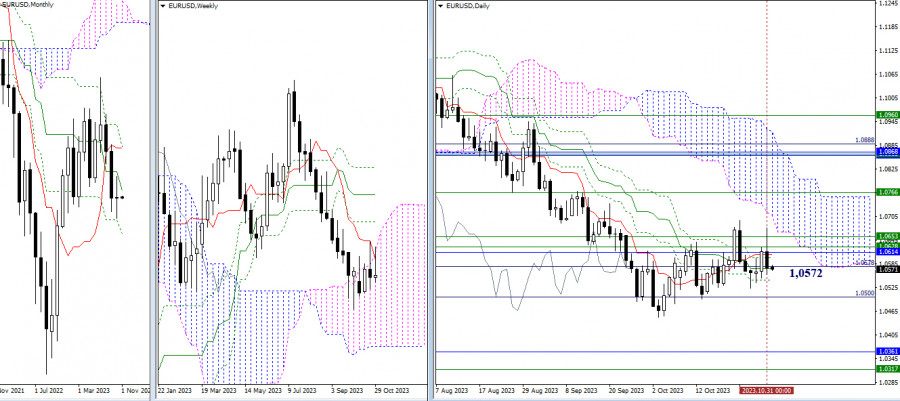
October closed with a candle of uncertainty. The market continues to operate within the range of daily levels, with the center of attraction being the medium-term trend (1.0572). At the start of the new trading month, minor adjustments to the Ichimoku indicator on the monthly timeframe led to the strengthening of the current weekly resistance zone (1.0628 - 1.0653) by the monthly medium-term trend (1.0614). As a result, the immediate objectives for bullish players, at the moment, are breaking through resistance levels (1.0614-28-53), updating the high (1.0695), and entering the daily cloud.

In the current situation, bearish players' prospects are focused on breaking through supports at 1.0500 - 1.0449 (the daily target level + the low) and declining towards the final level of the monthly Ichimoku cross (1.0360) and the lower boundary of the weekly cloud (1.0317).

This image is no longer relevant

H4 – H1

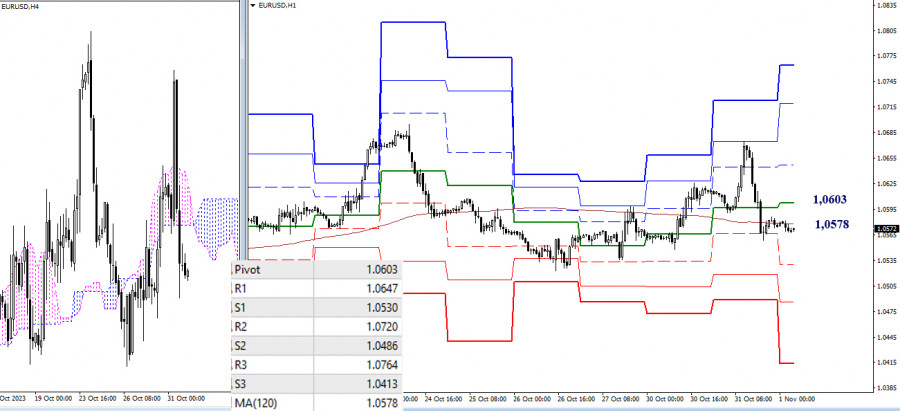
On the lower timeframes, there is also uncertainty in the past few hours. The market is hovering around the attraction zone of the weekly long-term trend (1.0578). The moving average is currently in a nearly horizontal position, confirming the balance of power. In the event of bearish activity and a strengthening of their sentiments, attention will be on passing through the supports of the classic pivot points (1.0530 - 1.0486 - 1.0413). If bulls restore their positions, their interests will shift towards breaking through the resistances of the classic pivot points (1.0603 - 1.0647 - 1.0720 - 1.0764).

***

GBP/USD

This image is no longer relevant

Higher Timeframes

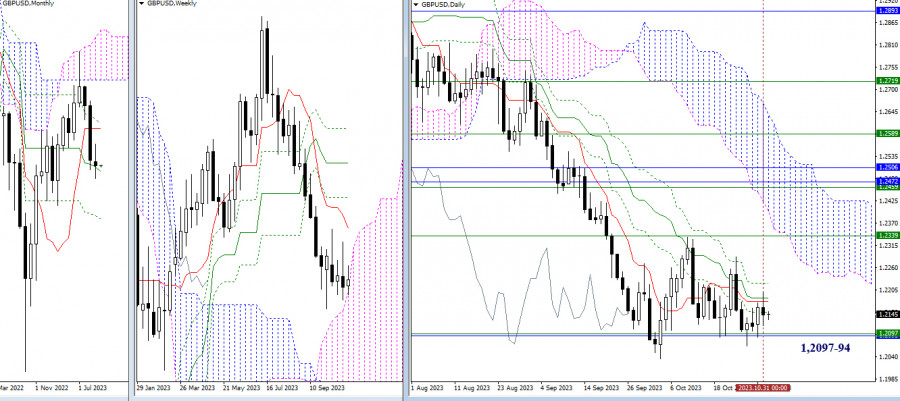
October did not provide clear support to any market players. The pair continues to consolidate around the upper boundary of the weekly cloud (1.2097). Most likely, the pound has decided to enter the weekly cloud in a sideways movement while utilizing the support of the monthly medium-term trend (1.2094). Only directed movement can change the situation. For bullish players, it is still important to overcome the attraction of the daily cross levels (1.2151 - 1.2178 - 1.2186 - 1.2221) and secure the support of the weekly short-term trend (1.2339). For bears, it is necessary to break free from the attraction of levels 1.2094 - 1.2097 and restore the downward trend (1.2036) to continue the decline.

This image is no longer relevant

H4 – H1

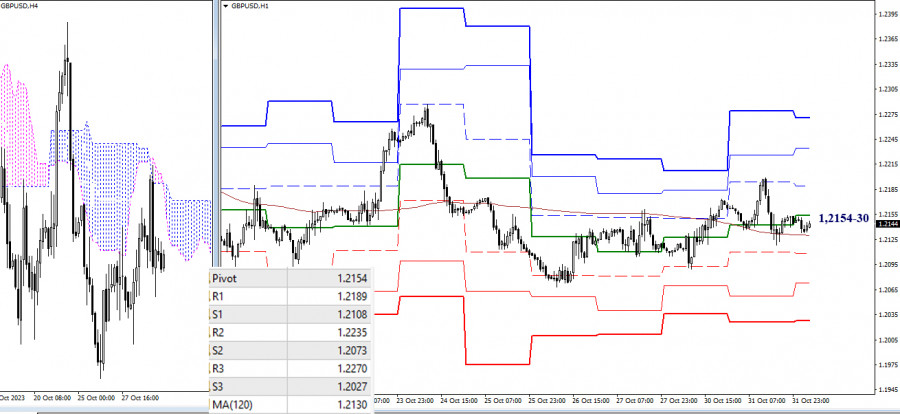
On the lower timeframes, the market is in a state of uncertainty and attraction to key levels, which are currently converging in the 1.2154-30 range (central pivot point + weekly long-term trend). Trading below these key levels will favor the development of bearish sentiments. Intraday bearish targets today are at 1.2108 - 1.2073 - 1.2027 (classic pivot points). Trading above these key levels will contribute to the strengthening of bullish positions. Intraday bullish targets can be noted at 1.2189 - 1.2235 - 1.2270 (resistances of the classic pivot points).

***

The technical analysis of the situation uses:

Higher timeframes - Ichimoku Kinko Hyo (9.26.52) + Fibo Kijun levels

Lower timeframes - H1 - Pivot Points (classic) + Moving Average 120 (weekly long-term trend)

Evangelos Poulakis,
Especialista em análise na InstaForex
© 2007-2025
Selecionar intervalo de tempo
5
min
15
min
30
min
1
hora
4
horas
1
dia
1
s.
Ganhe com as variações das taxas das criptomoedas com a InstaForex.
Baixe o MetaTrader 4 e abra a sua primeira operação.
  • Grand Choice
    Contest by
    InstaForex
    InstaForex always strives to help you
    fulfill your biggest dreams.
    PARTICIPE DO CONCURSO

Recommended Stories

Sinais de negociação para EUR/USD para 5-9 de junho de 2025: venda abaixo de 1,1474 (SMA 21 - 6/8 de Murray)

O indicador Eagle está mostrando um sinal negativo para o euro, sugerindo uma possível queda nos próximos dias. Portanto, nossa perspectiva permanece de baixa, enquanto o preço se consolidar abaixo

Dimitrios Zappas 17:36 2025-06-05 UTC+2

Sinais de negociação para o OURO (XAU/USD) para 5-9 de junho de 2025: venda abaixo de $3.387 (SMA 21 - 7/8 de Murray)

Por outro lado, se a força de alta prevalecer, podemos esperar uma recuperação técnica em torno de 3.355. Essa área forneceu ao ouro um bom ponto de recuperação no passado

Dimitrios Zappas 17:32 2025-06-05 UTC+2

Previsão para a prata em 5 de junho de 2025

Após um forte movimento em 2 de junho, o preço formou um pequeno padrão triangular nos dois dias seguintes, com a vela de ontem fechando no nível de abertura. Esta

Laurie Bailey 16:43 2025-06-05 UTC+2

Análise técnica do movimento intradiário dos preços do índice Nasdaq 100, quinta-feira, 5 de junho de 2025

O Índice Nasdaq 100 (#NDX) apresenta sinais técnicos de exaustão no curto prazo, com o Estocástico oscilando em zona de sobrecompra e a presença de divergência negativa em relação

Arief Makmur 16:29 2025-06-05 UTC+2

GBP/USD. 5 de junho. O mercado de trabalho envia sinais negativos

No gráfico horário, o par GBP/USD consolidou-se na quarta-feira acima do fraco nível de retração de 161,8% em 1,3520. Essa consolidação permite esperar um crescimento contínuo em direção ao próximo

Samir Klishi 15:51 2025-06-05 UTC+2

NZD/USD. Análise e previsão.

Hoje, o par NZD/USD continua atraindo compradores, embora ainda opere abaixo do nível de 0,6050. Os osciladores em todos os intervalos gráficos permanecem em território positivo e distantes das áreas

Irina Yanina 15:27 2025-06-05 UTC+2

Previsão para o EUR/USD em 5 de junho de 2025

Na quarta-feira, o par EUR/USD se recuperou da zona de suporte de 1,1374–1,1380 e reverteu a favor do euro. Um novo movimento de alta em direção ao nível de retração

Samir Klishi 14:28 2025-06-05 UTC+2

Análise técnica do movimento intradiário do preço da prata, quarta-feira, 4 de junho de 2025

A partir do que podemos ver no gráfico de 4 horas da prata, o indicador do oscilador estocástico parece estar em condição de sobrecompra, de modo que, em um futuro

Arief Makmur 18:18 2025-06-04 UTC+2

Análise técnica do movimento intradiário de preços do AUD/JPY, quarta-feira, 04 de junho de 2025

Embora, no gráfico horário, o AUD/JPY apresente potencial para uma correção e consequente enfraquecimento — conforme indicado pela condição do Oscilador Estocástico, que se encontra em sobrecompra —, enquanto

Arief Makmur 18:18 2025-06-04 UTC+2

Previsão para o AUD/USD para 4 de junho de 2025

O movimento do dólar australiano em direção à linha do canal de preços em 0,6548 foi adiado ontem devido a uma "falha" na tendência de baixa do dólar americano —

Laurie Bailey 17:07 2025-06-04 UTC+2
Não pode falar agora?
Faça sua pergunta no chat.
Widget callback
 

Dear visitor,

Your IP address shows that you are currently located in the USA. If you are a resident of the United States, you are prohibited from using the services of InstaFintech Group including online trading, online transfers, deposit/withdrawal of funds, etc.

If you think you are seeing this message by mistake and your location is not the US, kindly proceed to the website. Otherwise, you must leave the website in order to comply with government restrictions.

Why does your IP address show your location as the USA?

  • - you are using a VPN provided by a hosting company based in the United States;
  • - your IP does not have proper WHOIS records;
  • - an error occurred in the WHOIS geolocation database.

Please confirm whether you are a US resident or not by clicking the relevant button below. If you choose the wrong option, being a US resident, you will not be able to open an account with InstaForex anyway.

We are sorry for any inconvenience caused by this message.