empty
05.12.2023 03:34 PM
BITCOIN: Technical analysis of the situation

This image is no longer relevant

Higher timeframes

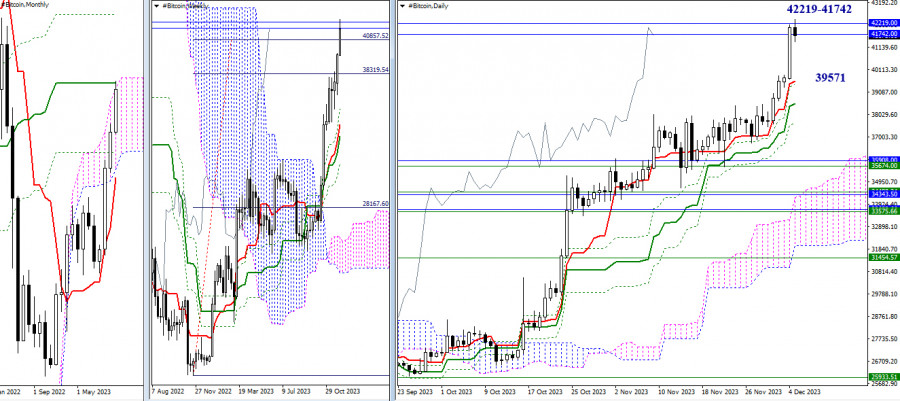
In November, Bitcoin slowly but steadily continued to rise. At the beginning of December, the upward momentum of market participants intensified. As a result, they not only achieved the weekly target of 40,857.52 (100% retracement) but also reached the confluence of monthly resistances at 42,219 – 41,742 (medium-term trend + upper boundary of the cloud). Breaking through these resistances and securely establishing in the bullish zone relative to the monthly cloud will significantly expand the upside potential for market participants. The next upward target will be the final level of the death cross of the monthly Ichimoku cloud (48,530), and in addition, a breakout target above the monthly cloud will be formed.

Failure to overcome these crucial and strong resistances may lead to the formation of a rebound and the initiation of a corrective decline. The daily timeframe will be the first to respond to this, with correction targets being the supports of the golden cross of the daily Ichimoku cloud, currently located at 39,571 (Tenkan) and 38,548 (Kijun). Next, for the development of a downward correction, the supports of the weekly golden cross will be considered, the nearest of which are currently at 35,674 and 34,472, with reinforcement from monthly support levels at 35,908 and 34,371.

This image is no longer relevant

H4 – H1

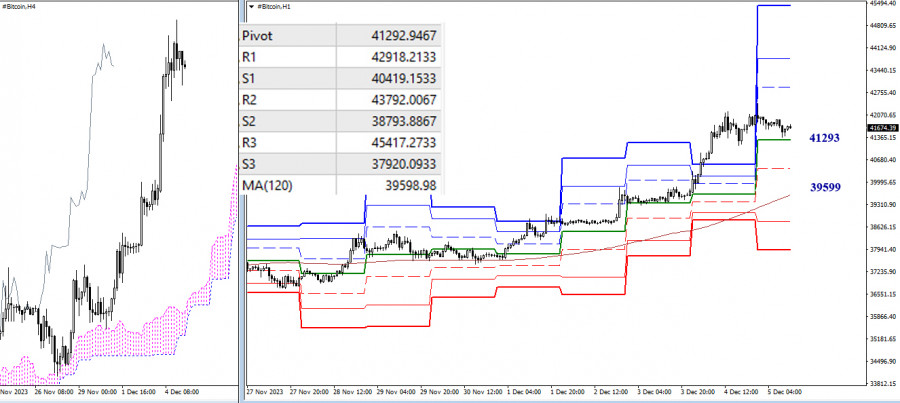
Bulls now have the main advantage on the lower timeframes. However, the pair has been in a corrective zone for a long time. Exiting the zone (42,424) will refocus the market's attention on bullish targets. Intraday bullish targets are represented by the resistances of classic pivot points (42,918 – 43,792 – 45,417). If the corrective decline receives a new impetus, the first tasks for bearish market participants will be testing and breaking through key levels at 41,293 (central pivot point of the day) and 39,599 (weekly long-term trend), with additional support from S1 (40,419). If consolidation below and a reversal of the movement occur, it will allow bearish market participants to change the current balance of power and strengthen their positions, also creating new bearish prospects as a result.

***

The technical analysis of the situation uses:

Higher timeframes - Ichimoku Kinko Hyo (9.26.52) + Fibo Kijun levels

H1 - Pivot Points (classic) + Moving Average 120 (weekly long-term trend)

Evangelos Poulakis,
InstaForex के विश्लेषणात्मक विशेषज्ञ
© 2007-2025
Summary
Urgency
Analytic
Zhizhko Nadezhda
Start trade
Earn on cryptocurrency rate changes with InstaForex
Download MetaTrader 4 and open your first trade
  • Grand Choice
    Contest by
    InstaForex
    InstaForex always strives to help you
    fulfill your biggest dreams.
    कॉन्टेस्ट में हिस्सा लें

अनुशंसित लेख

यदि Kiwi अपने पिवट स्तर से ऊपर तोड़ने में सफल रहता है, तो Kiwi में आज, सोमवार, 21 जुलाई 2025 को मजबूत होने की संभावना है।

हालांकि तकनीकी रूप से सभी संकेतक अभी भी कमजोरी की ओर इशारा करते हैं, लेकिन कीमत की चाल और RSI(14) संकेतक के बीच डाइवर्जेंस का उभरना आज NZD/USD मुद्रा युग्म

Arief Makmur 12:14 2025-07-21 UTC+2

EUR/USD में आज, सोमवार, 21 जुलाई 2025 को अपने निकटतम प्रतिरोध स्तर की ओर मजबूत होने की संभावना है।

हालांकि 50-दिवसीय मूविंग एवरेज (EMA) अभी भी 200-दिवसीय मूविंग एवरेज (EMA) से नीचे है, जो एक बेयरिश न्यूट्रल स्थिति को दर्शाता है, और RSI (14) भी बेयरिश न्यूट्रल स्तर

Arief Makmur 11:49 2025-07-21 UTC+2

यदि XAU/USD सफलतापूर्वक पिवट स्तर को तोड़कर उसके नीचे बंद होता है, तो इसमें अगले समर्थन स्तर तक गिरावट जारी रखने की संभावना है, फ्राइडा।y, July 18, 2025.

XAU/USD – शुक्रवार, 18 जुलाई, 2025। XAU/USD के कमजोर होने की संभावना जारी है, जैसा कि EMA (50) का EMA (200) के नीचे होना और RSI (14) का बीयरिश न्यूट्रल

Arief Makmur 08:49 2025-07-18 UTC+2

EUR/USD. 17 जुलाई. ट्रंप पॉवेल को फिर से बर्खास्त करना चाहते हैं

बुधवार को, EUR/USD जोड़ी 1.1574 पर 100.0% सुधारात्मक स्तर पर पहुँची, उससे उछली और 1.1712 पर 127.2% फिबोनाची स्तर तक पहुँची, जहाँ से भी यह उछली। परिणामस्वरूप, नवीनतम उलटफेर अमेरिकी

Samir Klishi 18:33 2025-07-17 UTC+2

GBP/USD. 17 जुलाई. ब्रिटेन में बेरोज़गारी लगातार बढ़ रही है

प्रति घंटा चार्ट पर, GBP/USD जोड़ी बुधवार को 1.3357–1.3371 के समर्थन क्षेत्र से उछलकर 1.3470 पर 76.4% सुधारात्मक स्तर पर पहुँच गई। 1.3470 से उछाल के कारण अमेरिकी डॉलर के

Samir Klishi 18:33 2025-07-17 UTC+2

DXY के अपने पिवट स्तर का परीक्षण करने की संभावना है, लेकिन गुरुवार, 17 जुलाई 2025 को इसके और अधिक मज़बूत होने की भी संभावना बनी हुई है।

अमेरिकी डॉलर इंडेक्स – गुरुवार, 17 जुलाई 2025 यदि पिवट और सपोर्ट स्तर निकट भविष्य में #USDX की कमजोरी सुधार को झेलने में सक्षम रहते हैं, तो #USDX के

Arief Makmur 11:53 2025-07-17 UTC+2

Nasdaq 100 इंडेक्स के कमजोर होने और गुरुवार, 17 जुलाई 2025 को अपने निकटतम सपोर्ट लेवल तक गिरने की संभावना है।

Nasdaq 100 इंडेक्स - गुरुवार, 17 जुलाई 2025 #NDX की कीमत की चाल EMA(20) और EMA(50) से नीचे है, जिसे RSI(14) के न्यूट्रल बेयरिश स्तर से समर्थन मिल रहा है।

Arief Makmur 11:50 2025-07-17 UTC+2

Forecast for EUR/USD on July 16, 2025

मंगलवार को, EUR/USD जोड़ी में गिरावट जारी रही और 85 अंकों की भारी गिरावट दर्ज की गई। 1.1645 के स्तर से नीचे एक मज़बूत बंद हमें 1.1574 पर अगले 100.0%

Samir Klishi 19:18 2025-07-16 UTC+2

GBP/USD. 16 जुलाई. ब्रिटेन में मुद्रास्फीति में वृद्धि जारी है

प्रति घंटा चार्ट पर, GBP/USD जोड़ी मंगलवार को 1.3371 पर 100.0% रिट्रेसमेंट स्तर की ओर गिरती रही। इस स्तर से वापसी या 1.3425 से ऊपर समेकन पाउंड के पक्ष में

Samir Klishi 19:18 2025-07-16 UTC+2

हालांकि USD/JPY में अपने पिवट पॉइंट स्तर तक सुधार (करेक्शन) की संभावना है, फिर भी इसमें बुधवार, 16 जुलाई 2025 को दोबारा मज़बूती दिखाने की संभावना बनी हुई है।

USD/JPY – बुधवार, 17 जुलाई 2025 हालांकि RSI(14) इंडिकेटर और USD/JPY की कीमत की चाल में विचलन (डाइवर्जेंस) देखा जा रहा है, फिर भी 50 EMA 200 EMA के

Arief Makmur 10:22 2025-07-16 UTC+2
अभी बात नहीं कर सकते?
अपना प्रश्न पूछें बातचीत.
Widget callback
 

Dear visitor,

Your IP address shows that you are currently located in the USA. If you are a resident of the United States, you are prohibited from using the services of InstaFintech Group including online trading, online transfers, deposit/withdrawal of funds, etc.

If you think you are seeing this message by mistake and your location is not the US, kindly proceed to the website. Otherwise, you must leave the website in order to comply with government restrictions.

Why does your IP address show your location as the USA?

  • - you are using a VPN provided by a hosting company based in the United States;
  • - your IP does not have proper WHOIS records;
  • - an error occurred in the WHOIS geolocation database.

Please confirm whether you are a US resident or not by clicking the relevant button below. If you choose the wrong option, being a US resident, you will not be able to open an account with InstaForex anyway.

We are sorry for any inconvenience caused by this message.