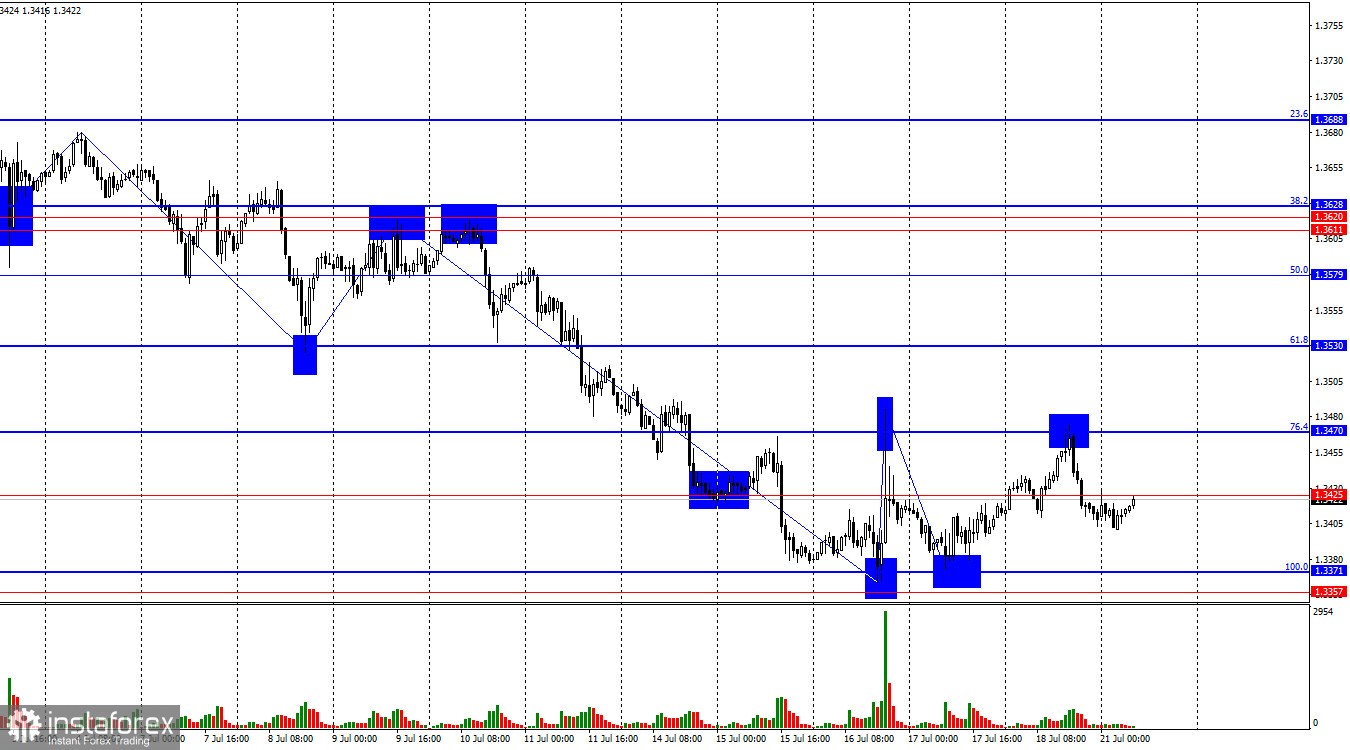
On the hourly chart, the GBP/USD pair on Friday rebounded from the 76.4% Fibonacci retracement level at 1.3470, reversing in favor of the U.S. dollar and pulling back slightly. Two bounces from 1.3470, two rebounds from the support zone at 1.3357–1.3371 — the chart clearly indicates that the pair has entered a sideways range. Therefore, until it breaks out of this range, it is best to trade from its boundaries only.
The wave situation has shifted slightly in favor of the bears, but this may be temporary. Several downward waves have been formed, each breaking the low of the previous one. At this point, the decline is not yet over, since the last upward wave has failed to break the high of the previous one. A consolidation above 1.3470 would mean that the last wave's high has been breached, signaling a potential trend reversal back to bullish.
There are very few economic events scheduled this week in both the UK and the US. Fed Chair Jerome Powell's speech on Tuesday will undoubtedly attract traders' attention, as will the July business activity indices. However, overall news is scarce, and traders are far more focused on Donald Trump's ongoing trade disputes. As of now, the U.S. has signed three trade agreements and has disputes with 75 countries — and that's just the "initial list." This list may expand over time — there are many countries in the world. With the August 1 deadline for negotiations approaching, the U.S. dollar may start to show signs of nervousness again. In recent weeks, the dollar has risen on positive expectations regarding trade talks or as part of a standard correction. But these corrections appear to be ending, and the optimism hasn't been confirmed by actual agreements. Thus, if the number of trade deals continues to grow at this slow pace, bulls may launch another large-scale offensive. On August 1, tariffs will rise against 24 countries, and new types of tariffs will take effect on selected goods — a new escalation of the trade war, a factor that has weighed on the dollar since the start of the year.
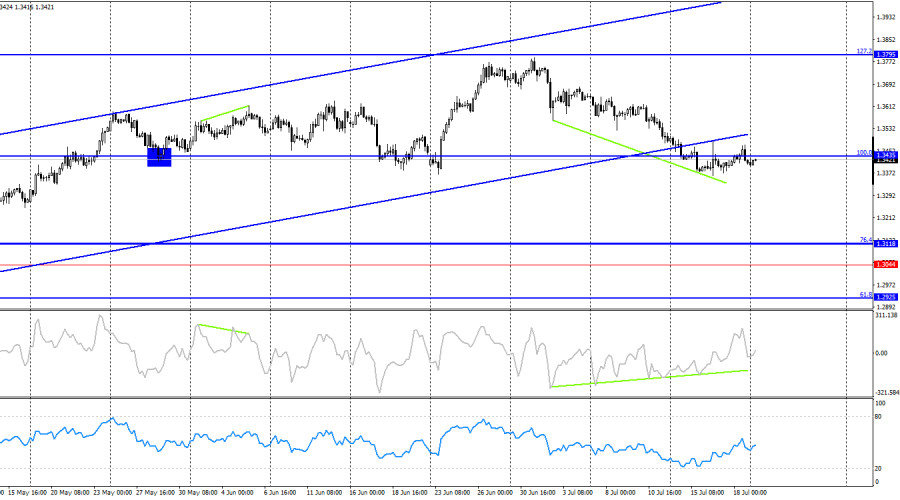
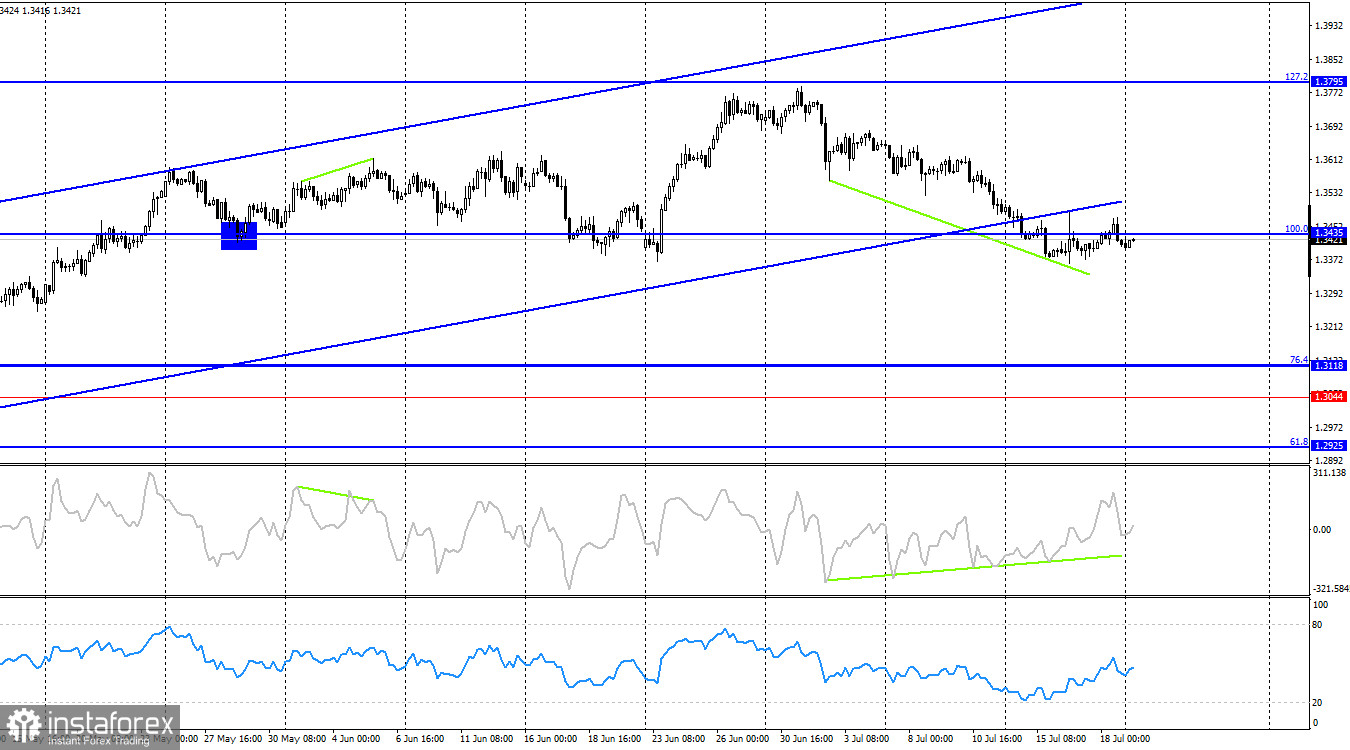
On the 4-hour chart, the pair has reversed in favor of the U.S. dollar and continues to decline. Last week, it consolidated below the 100.0% Fibonacci level at 1.3435 and below the ascending trend channel. However, I remain cautious about confirming a bearish trend, as there is little positive news coming from the U.S. I support the idea of a corrective pullback, but not a full-fledged bearish trend. Graphically, the decline may continue toward the next Fibonacci level of 76.4% at 1.3118, but on the hourly chart, there is strong support, and a bullish divergence suggests the possibility of a sharp upward move.
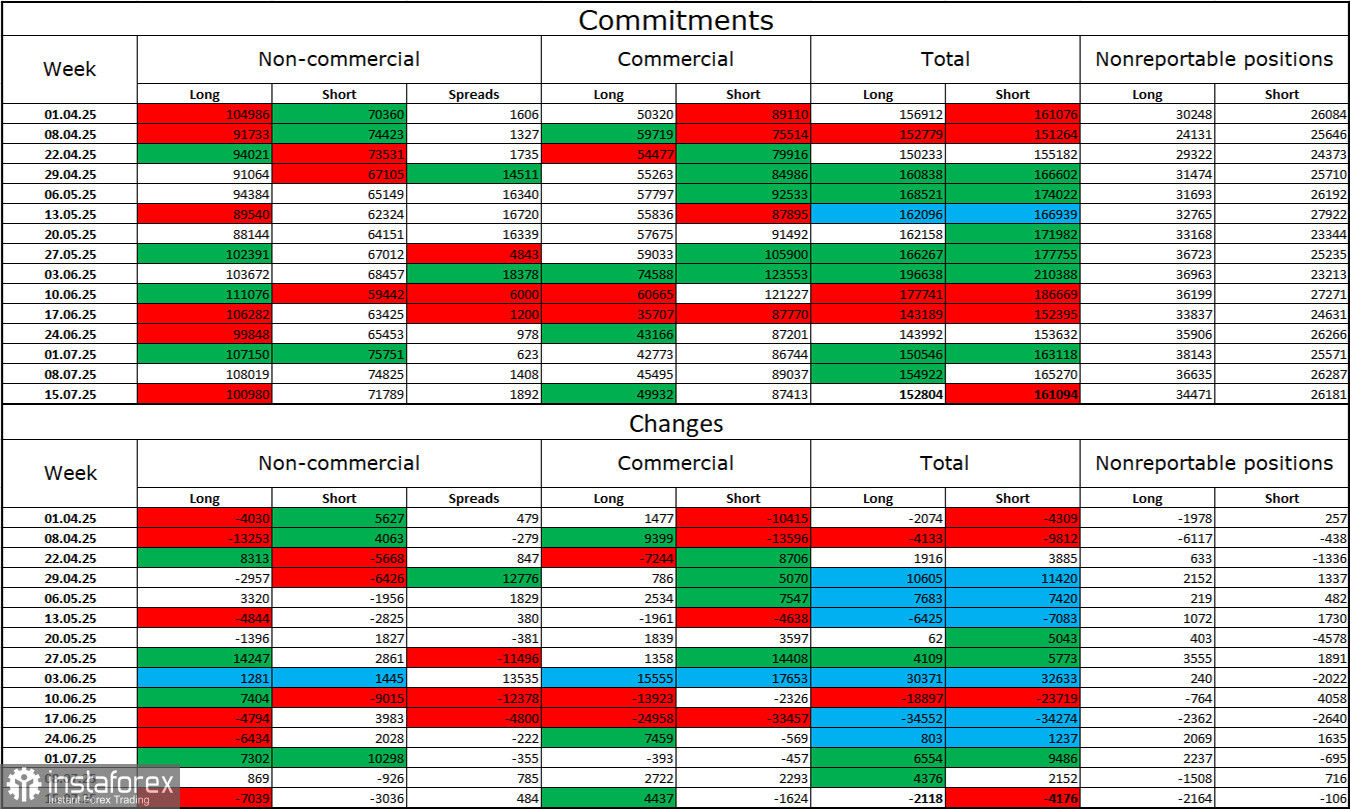
Commitments of Traders (COT) Report:
Sentiment among the "Non-commercial" trader category became slightly less bullish in the latest reporting week. The number of long positions held by speculators decreased by 7,039, while short positions fell by 3,036. However, bears have long lost the advantage in the market and have little chance of regaining it. The gap between long and short positions now stands at 30,000 in favor of the bulls: 101,000 versus 71,000.
In my view, the British pound still faces downside risks, but the events of 2025 have dramatically shifted the market's long-term outlook. Over the past four months, long positions have increased from 65,000 to 101,000, while shorts have declined from 76,000 to 71,000. Although the changes are not as stark as with the euro, they are still noticeable. Under Donald Trump, confidence in the dollar has weakened, and the COT data shows that traders are no longer eager to buy it. Thus, regardless of the broader news backdrop, the dollar continues to decline amid the developments surrounding Donald Trump.
News Calendar for the U.S. and the UK:
On Monday, the economic calendar contains no notable entries. As a result, market sentiment will not be influenced by the news background today.
GBP/USD Forecast and Trading Recommendations:
I do not recommend new short positions, as the dollar, in my opinion, has already overshot its downward potential. Long positions could have been opened on a rebound from the 1.3357–1.3371 zone with targets at 1.3425 and 1.3470 — both of which have already been reached. New buying opportunities may arise upon a close above 1.3470, with targets at 1.3530 and 1.3579.
The Fibonacci grids are drawn from 1.3371–1.3787 on the hourly chart and from 1.3431–1.2104 on the 4-hour chart.