GBP/USD 5M Chart Analysis
The GBP/USD pair extended last week's decline throughout Tuesday. As a reminder, the U.S. dollar had multiple factors supporting its potential strength last week, but it appreciated on only one day—and not in response to any strong macroeconomic data from the United States. This week, no macroeconomic publications have been released in either the UK or the U.S., while the overall fundamental background continues to work against the dollar. Yesterday it was reported that Donald Trump decided to raise tariffs for a number of countries from his so-called "blacklist," marking what appears to be the beginning of a new phase of escalation.
As has been repeatedly noted, the administration has failed to conclude many trade agreements—only three deals have been signed so far, although White House representatives continue to announce more agreements are "on the way." The agreement with China remains mostly undisclosed, the deal with the United Kingdom was viewed as assured three months ago, and the agreement with Vietnam appears to have little relevance to the market.
Recognizing the lack of progress, Trump offered another postponement—until August 1. But this came with the announcement of future tariff hikes from that date. In essence: "If we don't receive an offer by August 1 that we can't refuse, then tariffs will go up." It wouldn't be surprising if, on July 31, Trump again announces an increase while postponing implementation for several more weeks.
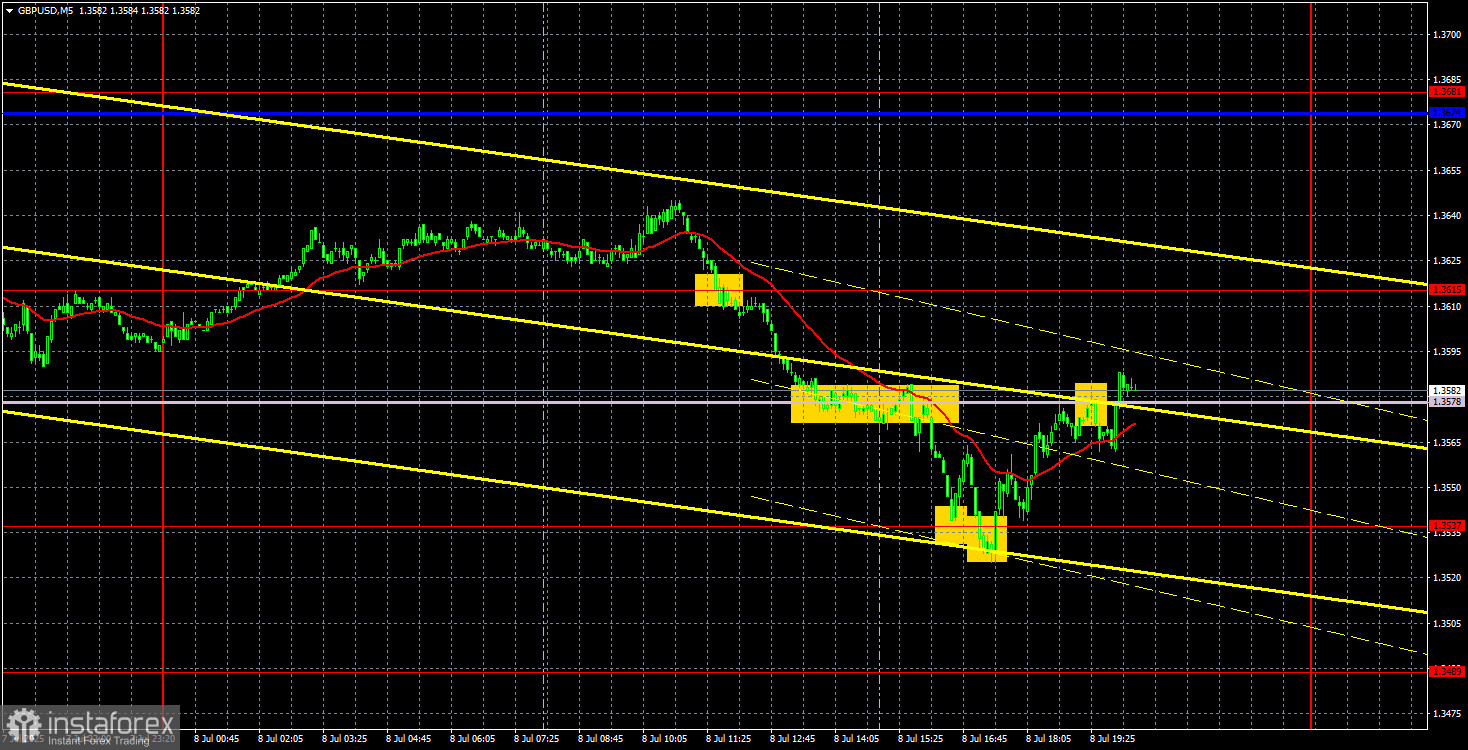
Several trading signals were formed on the 5-minute timeframe yesterday. First, the pair broke below the 1.3615 level, then through the Senkou Span B line, and finally bounced twice from the 1.3537 level. Traders could have opened short positions around 1.3615 and closed them after the rebound from 1.3537. Long trades were also possible, as by the end of the day, the pound had returned to the Senkou Span B line.
COT Report
COT reports for the British pound show that commercial traders' sentiment has shifted frequently in recent years. The red and blue lines, which represent the net positions of commercial and non-commercial traders, frequently intersect and generally remain close to the zero level. Currently, they are again close to each other, indicating a nearly equal number of long and short positions. However, over the past 18 months, the net position has generally been increasing, and in recent months it has been "bullish."
The dollar continues to decline due to Donald Trump's policies, so market maker demand for the pound is currently of limited importance. The trade war, in one form or another, is likely to continue for an extended period. Accordingly, demand for the dollar is expected to weaken. According to the latest report on the British pound, the "Non-commercial" group opened 7,300 long positions and 10,300 short positions. Thus, the net position decreased by 3,000 for the week, which is not particularly significant.
In 2025, the pound has appreciated significantly, but this has been driven by a single factor—Donald Trump's trade policy. Once this factor fades, the dollar may begin to strengthen again, but no one knows when that will happen. Trump's presidency has only just begun, and the next four years could bring many more market disruptions.
GBP/USD 1H Chart Analysis
On the hourly timeframe, the GBP/USD pair continues to decline, which may represent a technical correction. Last week, the market ignored all positive macroeconomic data from the United States, reacting only to the event in the British Parliament where Chancellor Rachel Reeves broke down during a debate. The Senkou Span B line failed to hold back the bears, so the dollar may continue strengthening in the short term.
Key Trading Levels for July 9:
- Support/Resistance Levels: 1.3212, 1.3288, 1.3358, 1.3439, 1.3489, 1.3537, 1.3615, 1.3741–1.3763, 1.3833, 1.3886
- Senkou Span B Line: 1.3578
- Kijun-sen Line: 1.3628
Note: The Ichimoku indicator lines may shift throughout the day and should be considered when identifying trading signals. It is recommended to place the Stop Loss at breakeven once the price moves 20 points in the correct direction to protect against false signals.
No major events are scheduled in the UK or the U.S. on Wednesday. However, this week the dollar has been ignoring its unfavorable fundamental backdrop and continues to strengthen steadily. A downward trend has formed. New buy positions will require a reversal of this trend.
Explanations to the illustrations:
- Support/Resistance Levels – Thick red lines near which price movement may end. Not considered trading signal sources.
- Kijun-sen and Senkou Span B Lines – Ichimoku indicator lines transferred from the 4-hour to the 1-hour chart. Considered strong levels.
- Extremum Levels – Thin red lines from which price previously rebounded. Serve as sources of trading signals.
- Yellow Lines – Trendlines, channels, and other technical patterns.
- COT Chart Indicator 1 – Represents the net position of each trader category.