empty
16.05.2025 03:54 AM
Trading Recommendations and Analysis for EUR/USD on May 16: The Market Has Once Again Confirmed the Obvious

EUR/USD 5-Minute Analysis

This image is no longer relevant

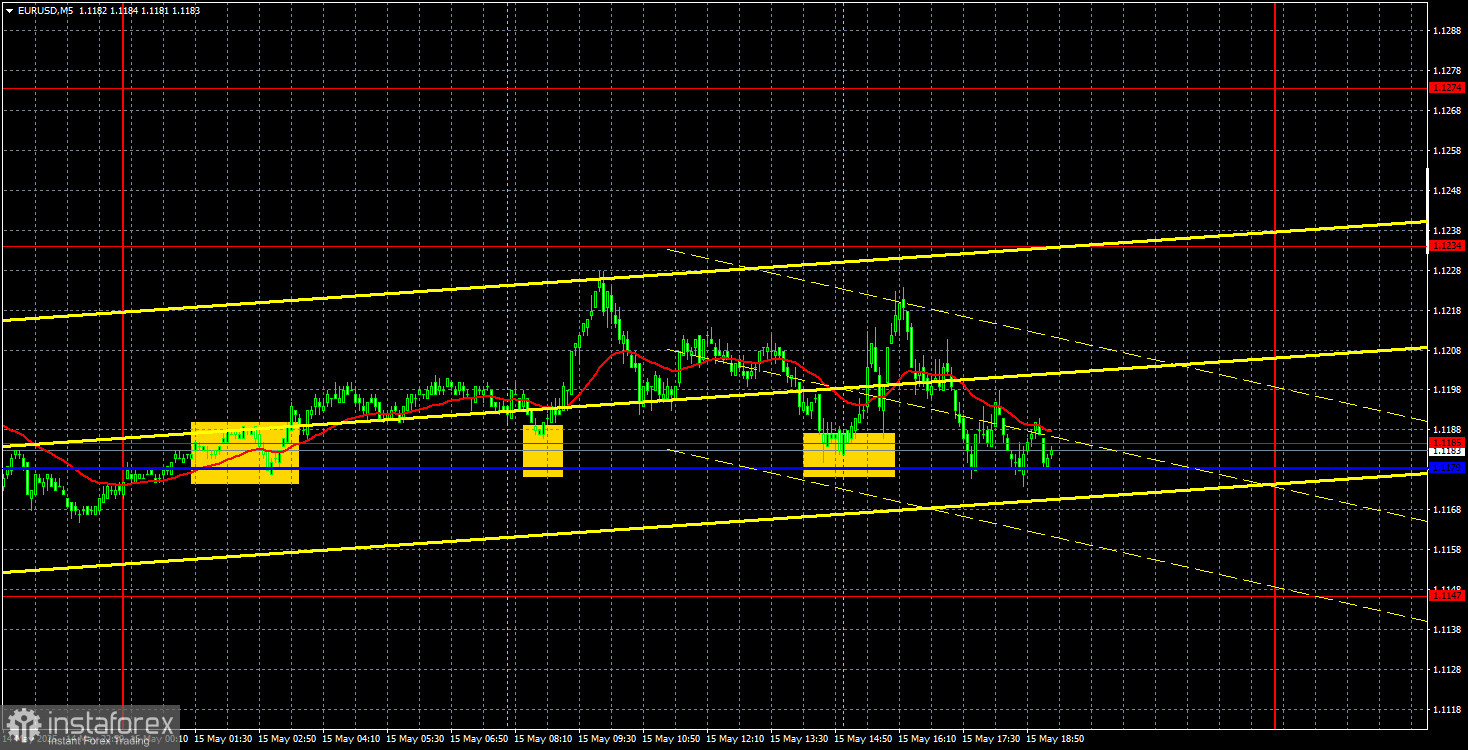
On Thursday, the EUR/USD currency pair showed only one thing—a complete unwillingness to move. We observed sideways movement throughout the day despite a fairly packed macroeconomic calendar. However, as mentioned in the previous article, while EU and U.S. reports might spark minor reactions, this data isn't enough to drive meaningful shifts. The market focuses solely on news related to the trade war or other high-profile statements by Donald Trump.

Nevertheless, we must point out the second estimate of the EU's Q1 GDP report. The initial estimate prompted traders to look optimistically at the euro, as the EU economy was reported to have grown by 0.4%. However, the second estimate showed a slowdown in economic growth. Meanwhile, U.S. data had no impact on the pair's movement.

As a result, the price pulled back slightly from Wednesday's highs but maintains a bearish trend overall. Since the U.S. has taken a path toward de-escalating the trade conflict, we assume that further strengthening of the U.S. dollar is likely. However, this strengthening will likely not be quick or easy.

On Thursday, the price rebounded three times from the 1.1179 (Kijun-sen line)–1.1185 area. In none of these instances was the pair able to reach the nearest target at 1.1234, although it approached that level closely twice. Thus, traders could open long positions, which could not have resulted in a loss. As for profits, they were possible only if the trades were closed manually.

COT Report

This image is no longer relevant

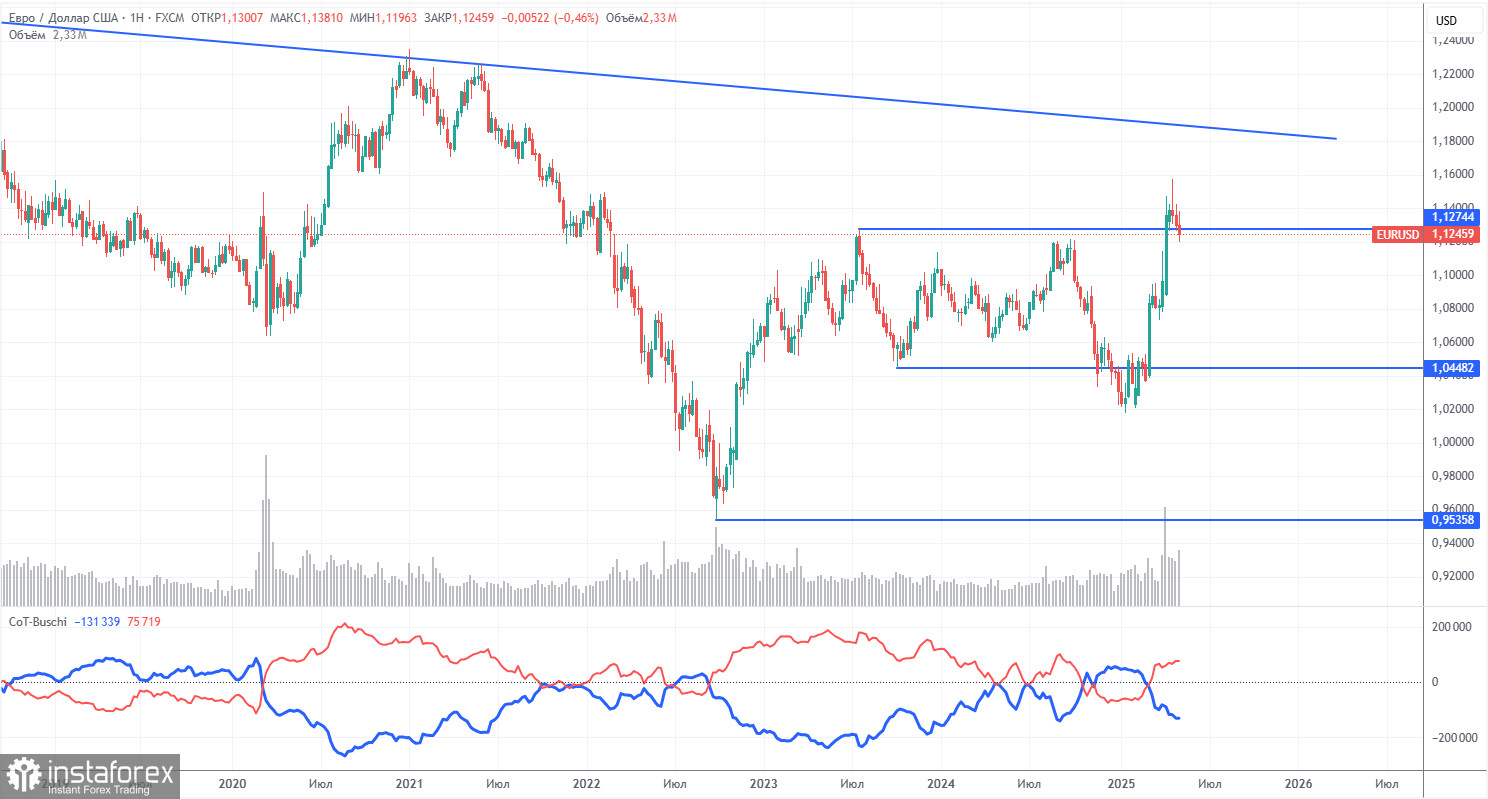
The latest COT (Commitment of Traders) report is dated May 6. As shown in the chart above, the net position of non-commercial traders remained bullish for a long time. Bears briefly took the lead but quickly lost it. Since Trump took office, the dollar has been in free fall. We can't say with certainty that the dollar's decline will continue, and the COT reports reflect the actual sentiment of large players, which can change rapidly under current circumstances.

We still see no fundamental factors for the euro to strengthen, but one major factor remains for the dollar to fall. The pair may continue to correct for several more weeks or months, but a 16-year downtrend will not reverse quickly. Once Trump concludes his trade wars, the dollar may return to growth.

The red and blue lines have crossed again, indicating a return to a bullish trend. Over the last reporting week, the number of longs among the "non-commercial" group decreased by 2,200, and the number of shorts decreased by 2,100. Accordingly, the net position remained virtually unchanged for the week.

EUR/USD 1-Hour Analysis

This image is no longer relevant

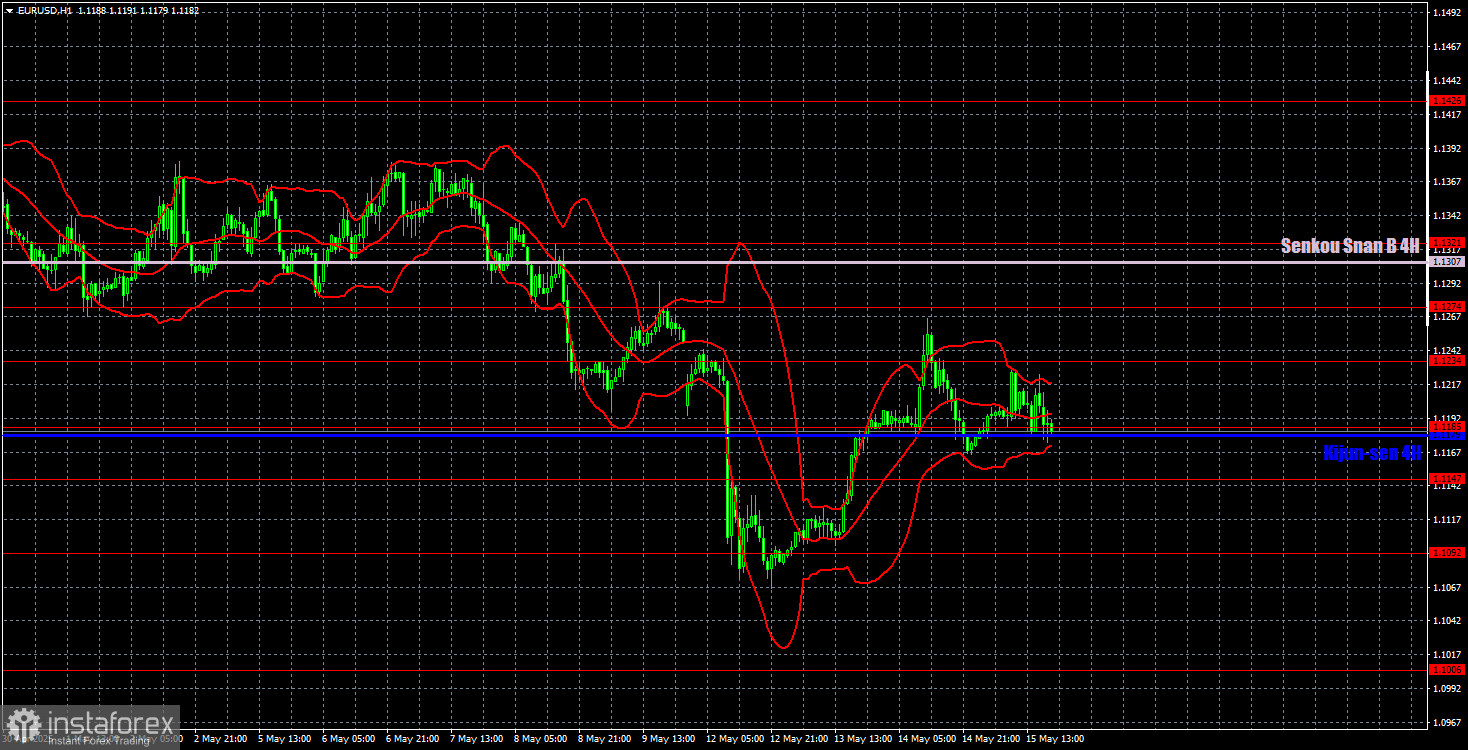
On the hourly timeframe, EUR/USD initiated a fairly substantial decline, followed by an equally strong correction. The pair's further downside prospects still depend entirely on developments in the global trade conflict. If trade agreements are signed and tariffs lowered, the U.S. dollar could continue climbing back toward the levels from which it initially fell. Technical analysis and macroeconomic data currently play only a minor role. Everything depends on news concerning trade negotiations.

Key Levels for May 16: 1.0823, 1.0886, 1.0949, 1.1006, 1.1092, 1.1147, 1.1185, 1.1234, 1.1274, 1.1321, 1.1426, 1.1534. Ichimoku Lines: Senkou Span B – 1.1307, Kijun-sen – 1.1179. Note: These Ichimoku indicator lines may shift throughout the day, so consider that when interpreting signals. Also, don't forget to move your Stop Loss to breakeven once the price moves 15 pips in the expected direction—this will help protect against false signals.

On Friday, the Eurozone has no major economic events scheduled, while the U.S. will release another set of secondary reports. The only item of interest might be the University of Michigan Consumer Sentiment Index, but it is scheduled for release in the evening. Thus, we are likely to observe the same calm movements with low volatility and sideways dynamics throughout the day—unless Donald Trump once again takes center stage.

Illustration Explanations:

  • Support and resistance price levels – thick red lines where movement may end. They are not trading signal sources.
  • Kijun-sen and Senkou Span B lines—These are strong Ichimoku indicator lines transferred to the hourly timeframe from the 4-hour one.
  • Extremum levels – thin red lines where the price has previously rebounded. These act as trading signal sources.
  • Yellow lines – trend lines, trend channels, and other technical patterns.
  • COT Indicator 1 on the charts – the size of the net position for each category of traders.
Paolo Greco,
Analytical expert of InstaForex
© 2007-2025
Select timeframe
5
min
15
min
30
min
1
hour
4
hours
1
day
1
week
Earn on cryptocurrency rate changes with InstaForex
Download MetaTrader 4 and open your first trade
  • Grand Choice
    Contest by
    InstaForex
    InstaForex always strives to help you
    fulfill your biggest dreams.
    JOIN CONTEST

Recommended Stories

Trading Recommendations and Analysis for GBP/USD on June 4: The Pound Doesn't Retreat Far

On Tuesday, the GBP/USD currency pair also showed a downward movement, although the decline and the day's volatility were relatively weak. Once again, the market effectively ignored the macroeconomic background

Paolo Greco 03:41 2025-06-04 UTC+2

Trading Recommendations and Analysis for EUR/USD on June 4: Inflation in the EU Is of No Interest to the Market

The EUR/USD currency pair started a weak downward movement on Tuesday, likely due to another mild corrective wave. Despite breaking through the trendline, the overall upward trend remains intact because

Paolo Greco 03:41 2025-06-04 UTC+2

GBP/USD: Trading Plan for the U.S. Session on June 3rd (Review of Morning Trades)

In my morning forecast, I pointed out the 1.3517 level and planned to base trading decisions on it. Let's look at the 5-minute chart and analyze what happened. A decline

Miroslaw Bawulski 18:47 2025-06-03 UTC+2

EUR/USD: Trading Plan for the U.S. Session on June 3rd (Review of Morning Trades)

In my morning forecast, I pointed out the 1.1404 level and planned to base trading decisions around it. Let's look at the 5-minute chart and see what happened. A decline

Miroslaw Bawulski 18:32 2025-06-03 UTC+2

How to Trade the GBP/USD Pair on June 3? Simple Tips and Trade Analysis for Beginners

Analysis of Monday's Trades 1H Chart of GBP/USD The GBP/USD pair also traded higher throughout Monday. However, the overall technical picture of the British pound differs slightly from that

Paolo Greco 06:27 2025-06-03 UTC+2

How to Trade the EUR/USD Pair on June 3? Simple Tips and Trade Analysis for Beginners

Analysis of Monday's Trades 1H Chart of EUR/USD The EUR/USD currency pair traded higher on Monday. We had warned that the dollar would likely decline again after Trump announced increased

Paolo Greco 06:27 2025-06-03 UTC+2

Trading Recommendations and Analysis for EUR/USD on June 3: Trump and ISM Hammer the Dollar

The EUR/USD currency pair showed fairly strong upward movement on Monday. Just as expected, the U.S. dollar started falling right from the market's opening on Monday night. What else could

Paolo Greco 03:57 2025-06-03 UTC+2

Trading Recommendations and Analysis for GBP/USD on June 3: The Pound Seized Another

As we had warned, the GBP/USD currency pair also traded strongly on Monday. The U.S. dollar got off lightly, as the fall could have been much sharper. Traders witnessed

Paolo Greco 03:57 2025-06-03 UTC+2

GBP/USD: Trading Plan for the U.S. Session on June 2nd (Review of Morning Trades)

In my morning forecast, I focused on the 1.3555 level and planned to base market entry decisions around it. Let's look at the 5-minute chart and analyze what happened

Miroslaw Bawulski 18:50 2025-06-02 UTC+2

EUR/USD: Trading Plan for the U.S. Session on June 2nd (Review of Morning Trades)

In my morning forecast, I focused on the 1.1416 level and planned to base market entry decisions around it. Let's look at the 5-minute chart and analyze what happened

Miroslaw Bawulski 18:47 2025-06-02 UTC+2
Can't speak right now?
Ask your question in the chat.
Widget callback
 

Dear visitor,

Your IP address shows that you are currently located in the USA. If you are a resident of the United States, you are prohibited from using the services of InstaFintech Group including online trading, online transfers, deposit/withdrawal of funds, etc.

If you think you are seeing this message by mistake and your location is not the US, kindly proceed to the website. Otherwise, you must leave the website in order to comply with government restrictions.

Why does your IP address show your location as the USA?

  • - you are using a VPN provided by a hosting company based in the United States;
  • - your IP does not have proper WHOIS records;
  • - an error occurred in the WHOIS geolocation database.

Please confirm whether you are a US resident or not by clicking the relevant button below. If you choose the wrong option, being a US resident, you will not be able to open an account with InstaForex anyway.

We are sorry for any inconvenience caused by this message.