empty
13.05.2025 05:08 AM
Trading Recommendations and Analysis for EUR/USD on May 13: Unexpected Origins

EUR/USD 5-Minute Analysis

This image is no longer relevant

The EUR/USD currency pair showed strong downward movement on Monday, which hasn't happened in quite a while. However, the reasons behind the sharp and sudden surge in the U.S. dollar are rather evident. China and the U.S. unexpectedly agreed during their first consultation to reduce mutual tariffs by 115%. In other words, only 30% tariffs from the U.S. and 10% from China remain. Apparently, these numbers satisfied both sides, and the market breathed a sigh of relief.

Let us recall that the previous tariff regime of 145%-125% effectively halted trade between the two nations. Sooner or later, it is evident that the parties would come to an agreement, as a trade war benefits no one. China never denied its readiness for negotiations, and the U.S. waited for Beijing to make the first move. Eventually, a meeting took place in Switzerland and became highly productive. The dollar responded with a sharp rally, precisely what we had anticipated last week. If the dollar collapses on trade war escalation news, it should strengthen just as powerfully on de-escalation news—precisely what happened.

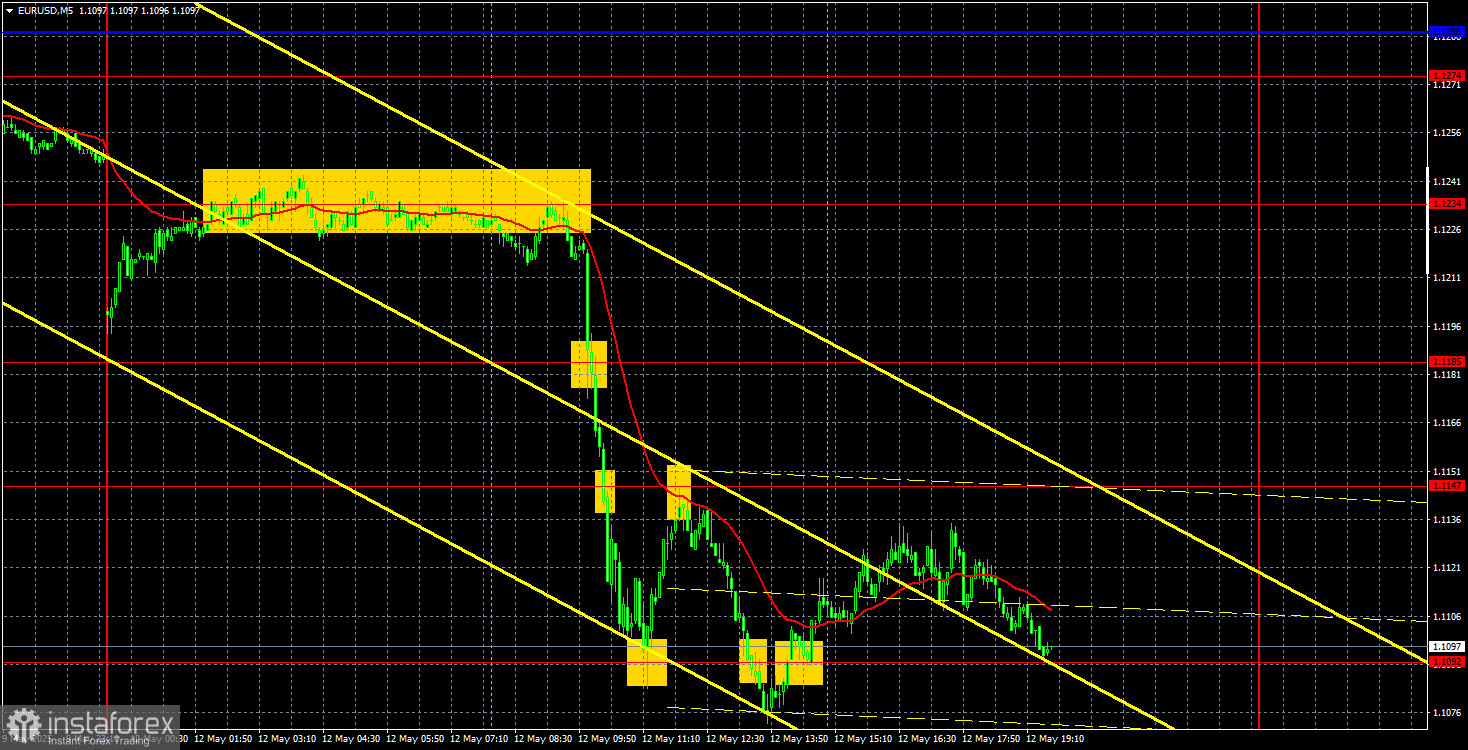
In the 5-minute timeframe, the rebound from the 1.1234 level marked the start of the collapse. Naturally, the crash was triggered by progress in the U.S.-China negotiations, not by a technical signal. However, both events coincided perfectly. Traders could have opened short positions, and the decline continued to 1.1092. From that level, the price rebounded upward to 1.1147, bounced off, and returned to 1.1092. Thus, traders had at least two more opportunities to open profitable trades.

COT Report

This image is no longer relevant

The latest COT (Commitment of Traders) report is dated May 6. As shown in the chart above, the net position of non-commercial traders remained bullish for a long time. Bears briefly took the lead but quickly lost it. Since Trump took office, the dollar has been in free fall. We can't say with certainty that the dollar's decline will continue, and the COT reports reflect the actual sentiment of large players, which can change rapidly under current circumstances.

We still see no fundamental factors for the euro to strengthen, but one major factor remains for the dollar to fall. The pair may continue to correct for several more weeks or months, but a 16-year downtrend will not reverse quickly. Once Trump concludes his trade wars, the dollar may return to growth.

The red and blue lines have crossed again, indicating a return to a bullish trend. Over the last reporting week, the number of longs among the "non-commercial" group decreased by 2,200, and the number of shorts decreased by 2,100. Accordingly, the net position remained virtually unchanged for the week.

EUR/USD 1-Hour Analysis

This image is no longer relevant

In the hourly timeframe, the EUR/USD pair has begun a relatively strong decline, but its prospects still depend on how the global trade war unfolds. If new trade agreements are signed and tariffs are reduced, the U.S. dollar will likely continue rising toward the levels it had before its decline began. Technical factors now have minimal impact—it's all about trade war headlines.

For May 13, the following levels are highlighted for trading: 1.0823, 1.0886, 1.0949, 1.1006, 1.1092, 1.1147, 1.1185, 1.1234, 1.1274, 1.1321, 1.1426, 1.1534, as well as the Senkou Span B line (1.1346) and the Kijun-sen line (1.1227). The Ichimoku indicator lines may shift throughout the day, so this should be considered when identifying signals. Don't forget to set Stop Loss to breakeven if the price moves in the right direction by 15 pips—this will help prevent losses from false signals.

The U.S. is scheduled to publish its inflation report, but let us remind you that the market is not responding much to macroeconomic data. Trade war headlines are far more influential. Although traders might react to the inflation print, this report is unlikely to have any major impact right now. We've already seen the market easily ignore the "hawkish" Fed meeting.

Illustration Explanations:

  • Support and resistance price levels – thick red lines where movement may end. They are not trading signal sources.
  • Kijun-sen and Senkou Span B lines—These are strong Ichimoku indicator lines transferred to the hourly timeframe from the 4-hour one.
  • Extremum levels – thin red lines where the price has previously rebounded. These act as trading signal sources.
  • Yellow lines – trend lines, trend channels, and other technical patterns.
  • COT Indicator 1 on the charts – the size of the net position for each category of traders.
Paolo Greco,
Analytical expert of InstaForex
© 2007-2025
Select timeframe
5
min
15
min
30
min
1
hour
4
hours
1
day
1
week
Earn on cryptocurrency rate changes with InstaForex
Download MetaTrader 4 and open your first trade
  • Grand Choice
    Contest by
    InstaForex
    InstaForex always strives to help you
    fulfill your biggest dreams.
    JOIN CONTEST

Recommended Stories

How to Trade the GBP/USD Pair on June 12? Simple Tips and Trade Analysis for Beginners

Analysis of Wednesday's Trades 1H Chart of GBP/USD On Wednesday, the GBP/USD pair moved in a manner similar to the EUR/USD pair. The U.S. inflation report became a new driver

Paolo Greco 06:05 2025-06-12 UTC+2

How to Trade the EUR/USD Pair on June 12? Simple Tips and Trade Analysis for Beginners

Analysis of Wednesday's Trades 1H Chart of EUR/USD On Wednesday, the EUR/USD currency pair resumed its upward trend, lasting more than four months. More precisely, it has continued since Donald

Paolo Greco 06:05 2025-06-12 UTC+2

Trading Recommendations and Analysis for GBP/USD on June 12: The Pound Finds a New Reason to Cheer

On Wednesday, the GBP/USD currency pair resumed its upward movement. As previously noted, the British currency currently has no valid reason to decline against the U.S. dollar—specifically, against the U.S

Paolo Greco 04:00 2025-06-12 UTC+2

Trading Recommendations and Analysis for EUR/USD on June 12: Even Inflation Didn't Please the Dollar

The EUR/USD currency pair traded very differently throughout Wednesday. During the European trading session, the pair continued its sideways movement, which had persisted for several days. There was no macroeconomic

Paolo Greco 03:55 2025-06-12 UTC+2

GBP/USD: Trading Plan for the U.S. Session on June 11th (Review of Morning Trades)

In my morning forecast, I drew attention to the 1.3483 level and planned to make trading decisions based on it. Let's look at the 5-minute chart and analyze what happened

Miroslaw Bawulski 18:41 2025-06-11 UTC+2

EUR/USD: Trading Plan for the U.S. Session on June 11th (Review of Morning Trades)

In my morning forecast, I highlighted the 1.1425 level and planned to make entry decisions based on it. Let's look at the 5-minute chart and examine what happened. The price

Miroslaw Bawulski 18:38 2025-06-11 UTC+2

How to Trade the GBP/USD Pair on June 11? Simple Tips and Trade Analysis for Beginners

Analysis of Tuesday's Trades 1H Chart of GBP/USD On Tuesday, the GBP/USD pair traded with a downward bias, which was justified by a few factors. First, the pair consolidated below

Paolo Greco 06:10 2025-06-11 UTC+2

How to Trade the EUR/USD Pair on June 11? Simple Tips and Trade Analysis for Beginners

Analysis of Tuesday's Trades 1H Chart of EUR/USD On Tuesday, the EUR/USD currency pair again showed no intention of actively trading. Over the past three days, a sideways channel

Paolo Greco 06:10 2025-06-11 UTC+2

Trading Recommendations and Analysis for GBP/USD on June 11: The Pound Pauses Before a New Surge

The GBP/USD currency pair continued trading rather chaotically on Tuesday but with a bearish tone. The British pound at least slightly declined after the trend shifted downward. Recall that

Paolo Greco 03:31 2025-06-11 UTC+2

Trading Recommendations and Analysis for EUR/USD on June 11: Flat Movement at Highs

The EUR/USD currency pair continued to move in both directions throughout Tuesday. These movements indicate a flat market. Let us recall that earlier, the pair broke through the ascending trend

Paolo Greco 03:31 2025-06-11 UTC+2
Can't speak right now?
Ask your question in the chat.
Widget callback
 

Dear visitor,

Your IP address shows that you are currently located in the USA. If you are a resident of the United States, you are prohibited from using the services of InstaFintech Group including online trading, online transfers, deposit/withdrawal of funds, etc.

If you think you are seeing this message by mistake and your location is not the US, kindly proceed to the website. Otherwise, you must leave the website in order to comply with government restrictions.

Why does your IP address show your location as the USA?

  • - you are using a VPN provided by a hosting company based in the United States;
  • - your IP does not have proper WHOIS records;
  • - an error occurred in the WHOIS geolocation database.

Please confirm whether you are a US resident or not by clicking the relevant button below. If you choose the wrong option, being a US resident, you will not be able to open an account with InstaForex anyway.

We are sorry for any inconvenience caused by this message.