GBP/USD 5-Minute Analysis
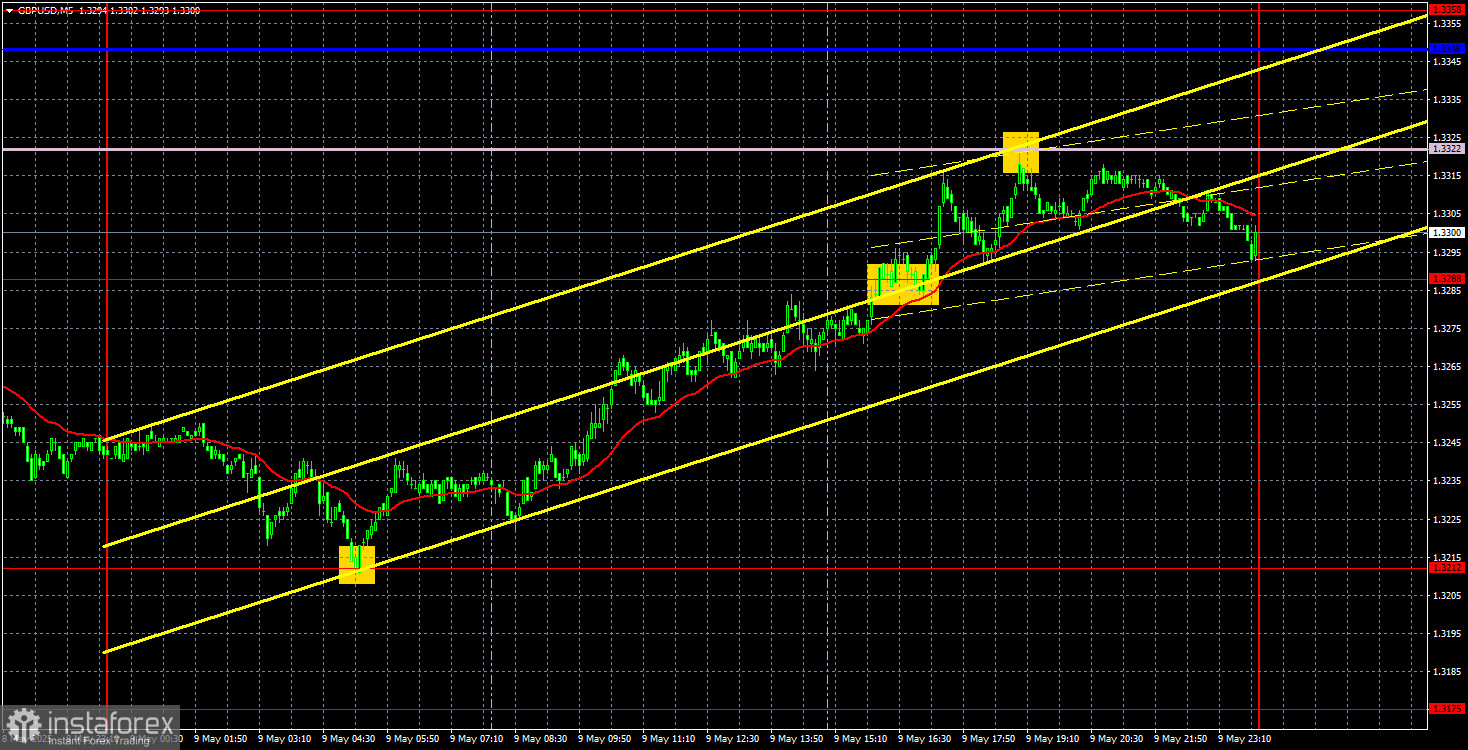
On Friday, the GBP/USD currency pair initially exited its sideways channel but quickly and confidently recovered to the Senkou Span B line. From a technical standpoint, the flat range could be considered complete, but the consolidation below the channel was weak, and bears failed to overcome even the first support level on the way down (1.3212). Technically, the price corrected to Senkou Span B, so a renewed decline could start as early as Monday. However, the Ichimoku indicator lines are not strong in a flat market.
It's worth remembering that any new decision by Trump that escalates the trade conflict or undermines the uncertain progress in negotiations with China and the EU could trigger a mass sell-off of the dollar. Trump can easily create a new precedent to pressure Brussels or Beijing. So even though the dollar has reasons to rise (especially after a 1300-pip fall), buying it remains risky.
There were no macroeconomic reports on Friday, but earlier in the week, at least three major events supported the dollar. However, they didn't significantly help the U.S. currency.
In the 5-minute timeframe, Friday's price action was quite strong, as the pair mainly moved in one direction. A good buy signal formed near the 1.3212 level during the Asian session, and by the time the European session opened, traders had a chance to enter the market. By the end of the day, the pair reached the Senkou Span B line, where long positions could be closed. The profit amounted to at least 80 pips.
COT Report
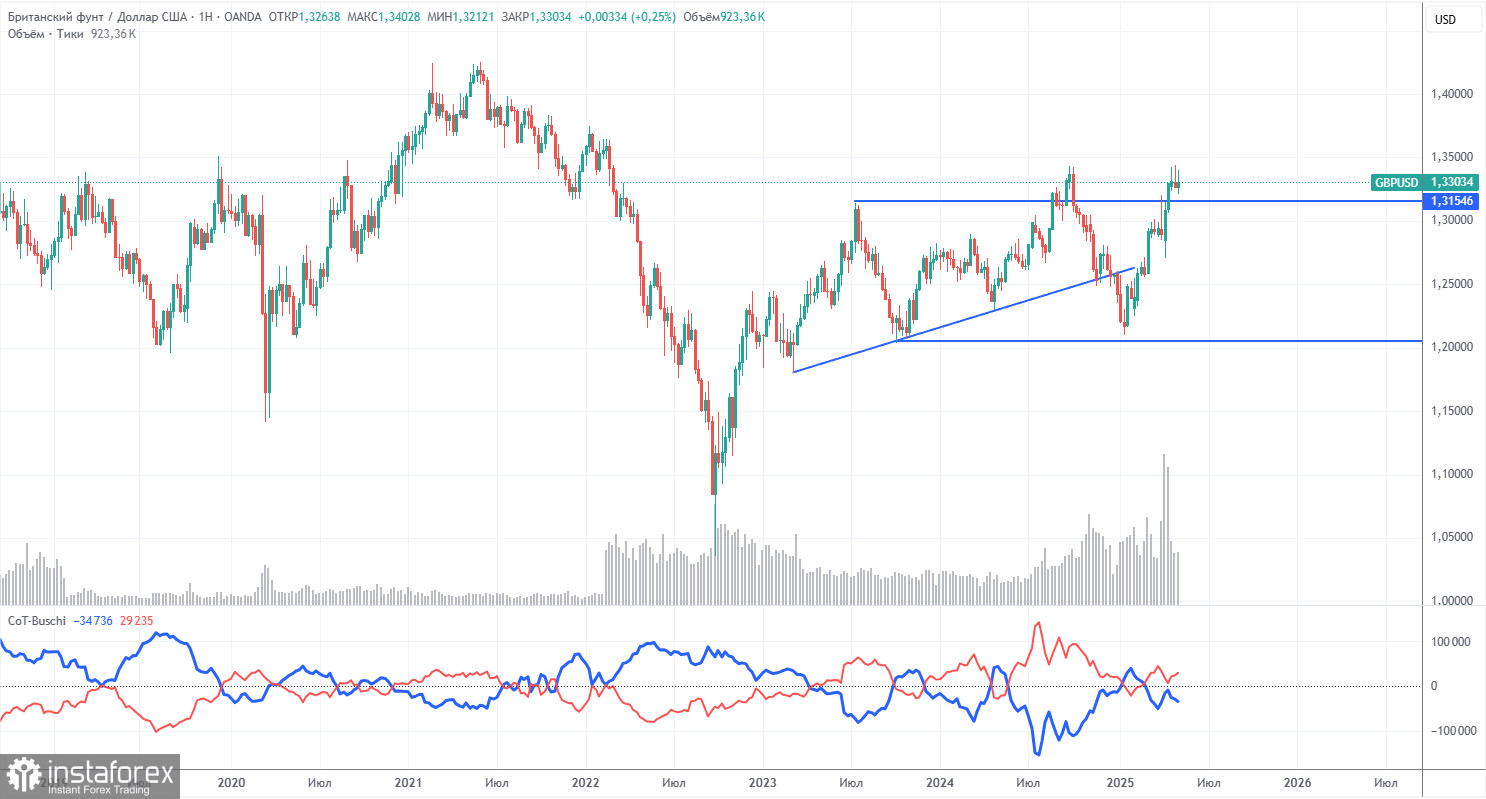
COT reports for the British pound show that commercial traders' sentiment has fluctuated frequently in recent years. The red and blue lines, representing net positions of commercial and non-commercial traders, cross regularly and typically remain near the zero line. They are again close to each other, indicating roughly equal numbers of long and short positions.
In the weekly timeframe, the price broke below the 1.3154 level, then broke a trend line, returned to 1.3154, and broke again. Breaking the trend line indicates a high probability that the pound will continue to fall. However, we see that the dollar keeps dropping due to Donald Trump. Therefore, the trade war news could continue pushing the pound higher despite technical factors.
According to the latest COT report on the British pound, the "Non-commercial" group opened 3,300 long contracts and closed 1,900 short contracts, increasing their net position by 5,200 contracts.
The fundamental backdrop still offers no justification for long-term purchases of the pound sterling, and the currency has real chances to resume a global downtrend. The pound has risen sharply recently, but we must remember that Donald Trump's policy is the sole reason. Once that factor is removed, the dollar may begin to strengthen.
GBP/USD 1-Hour Analysis
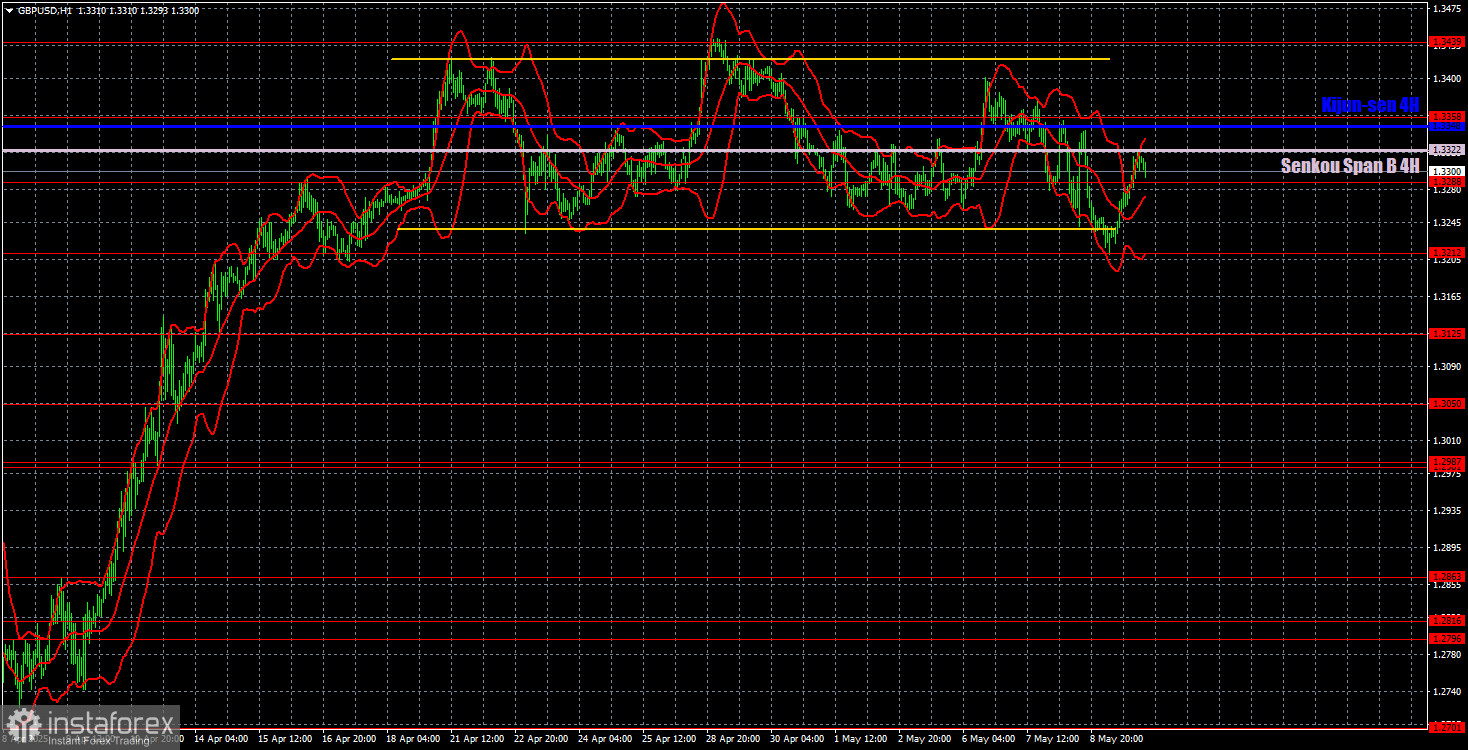
GBP/USD maintains a bullish trend on the hourly timeframe, as the three-week flat phase hasn't broken or ended the uptrend. The pound sterling has shown significant growth in recent months, although this has nothing to do with its strength. The upward movement of the pound is due to the dollar's decline, which was driven by Donald Trump. And this decline is not over yet. A trade agreement between the UK and the US has been signed, but this doesn't shield the dollar from Trump's future decisions on other countries. The Bank of England cut its key rate, the Federal Reserve left theirs unchanged, but the market is ignoring these developments. Thus, disorder and chaos persist in the market, while logic and consistency are lacking.
Key trading levels for May 12: 1.2691–1.2701, 1.2796–1.2816, 1.2863, 1.2981–1.2987, 1.3050, 1.3125, 1.3212, 1.3288, 1.3358, 1.3439, 1.3489, 1.3537. Ichimoku indicator lines: Senkou Span B (1.3322) and Kijun-sen (1.3348) may also provide trade signals. Moving the Stop Loss to breakeven if the price moves 20 pips in the right direction is recommended. Ichimoku lines can shift throughout the day, so they should be monitored when assessing trade setups.
No major events or reports are scheduled in the UK or the US on Monday, so we shouldn't expect strong price movements. Theoretically, a decline may begin from the Senkou Span B line, but it's worth remembering that the market is reluctant to buy the dollar under any circumstances.
Illustration Explanations:
- Support and resistance price levels – thick red lines where movement may end. They are not trading signal sources.
- Kijun-sen and Senkou Span B lines—These are strong Ichimoku indicator lines transferred to the hourly timeframe from the 4-hour one.
- Extremum levels – thin red lines where the price has previously rebounded. These act as trading signal sources.
- Yellow lines – trend lines, trend channels, and other technical patterns.
- COT Indicator 1 on the charts – the size of the net position for each category of traders.