empty
09.05.2025 04:05 AM
Trading Recommendations and Analysis for GBP/USD on May 9: The Pound Remains Unshaken

GBP/USD 5-Minute Analysis

This image is no longer relevant

On Thursday, the GBP/USD currency pair continued trading within the sideways channel, visible in the hourly timeframe. Two central bank meetings — each of which could be considered favorable for the U.S. dollar — failed to trigger either an exit from the flat phase or any significant dollar strengthening. Meanwhile, EUR/USD managed to end its three-week flat phase, despite having fewer objective reasons to decline on Wednesday and Thursday. As we've said before, market movements have practically no logic.

The only factor that could be considered a win for the pound over the past two days is Donald Trump's declaration of a trade agreement between the United Kingdom and the United States. However, there are no details about the deal—no information on the terms, tariffs, or obligations—so the cause for celebration seems highly questionable. In any case, many questions about the recent moves in both currency pairs remain unanswered.

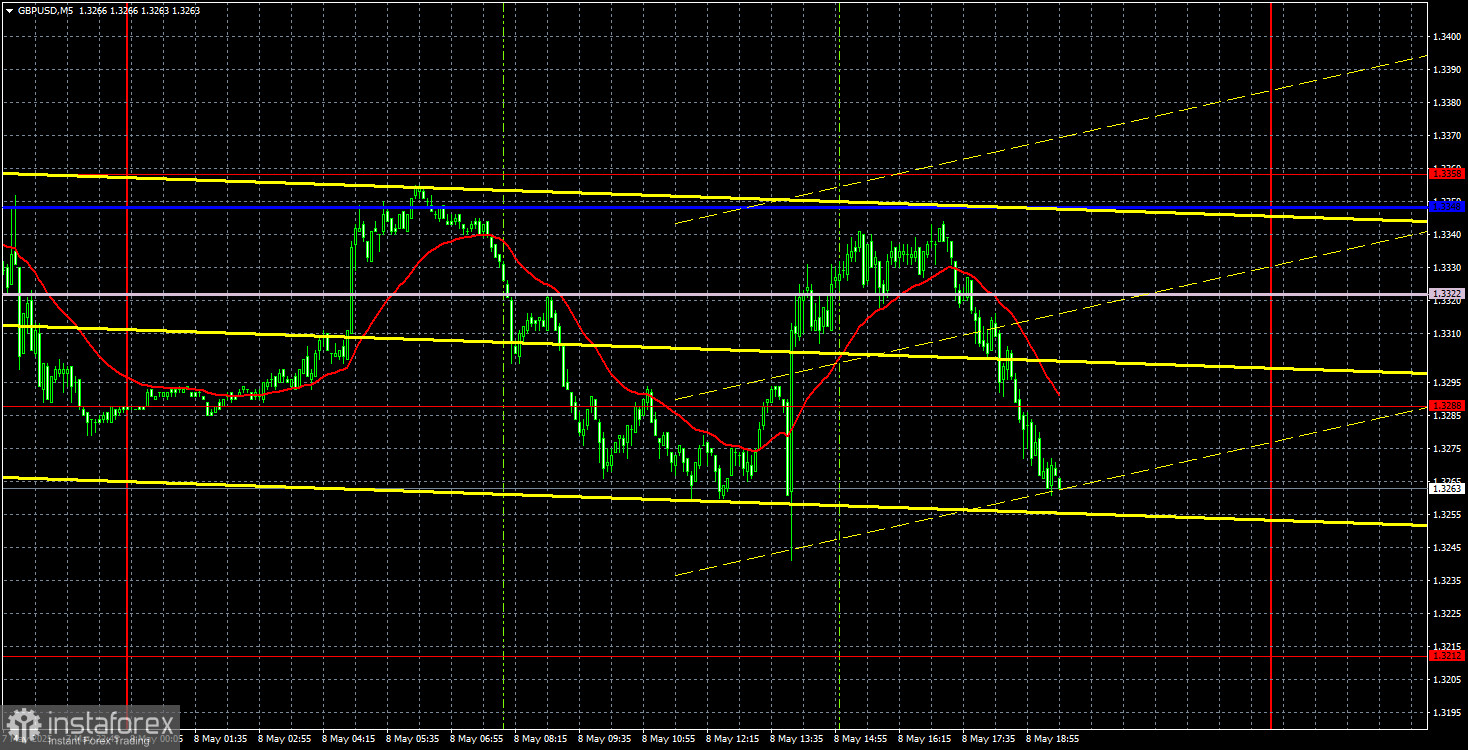
Technically, Thursday's trading in the pair was chaotic. The pair rose, then fell, then rose again, then fell once more. We didn't mark any trading signals on the chart illustration because all movements took place in a zone cluttered with technical levels and Ichimoku indicator lines every 30–40 pips. Opening trades in between such tight levels was simply pointless.

COT Report

This image is no longer relevant

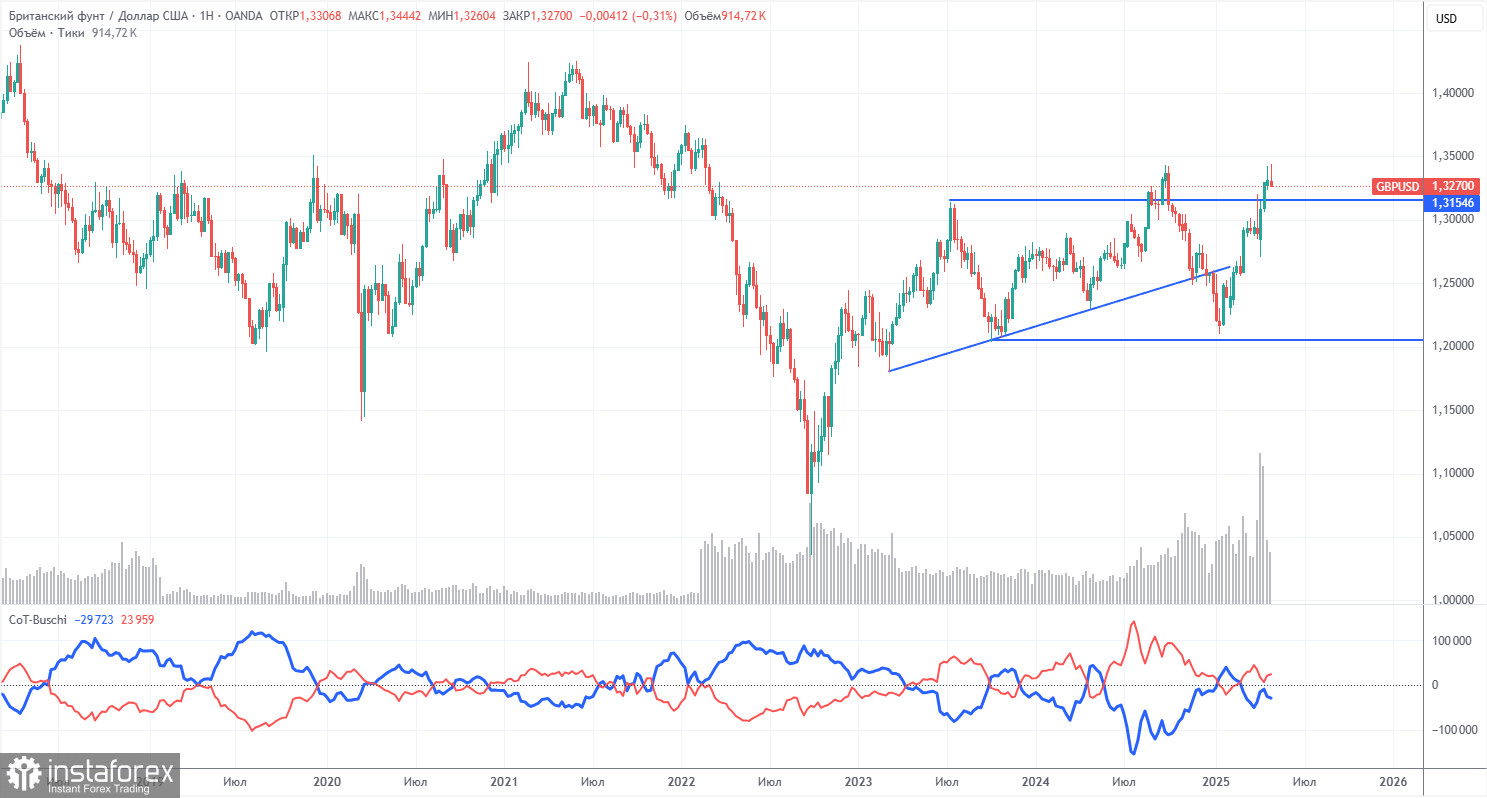
COT reports for the British pound show that commercial traders' sentiment has constantly shifted in recent years. The red and blue lines—representing net positions of commercial and non-commercial traders—frequently intersect and mostly hover near the zero mark. That's the case now, indicating a relatively balanced number of long and short positions.

On the weekly timeframe, the price initially broke through the 1.3154 level, then surpassed the trend line, returned to 1.3154, and broke it again. Breaking the trend line suggests a high probability of further pound depreciation. However, the dollar continues to fall due to Donald Trump. Therefore, despite technical signals, news about the trade war could keep pushing the pound higher.

According to the latest report on the British pound, the "Non-commercial" group closed 2,900 BUY contracts and 6,400 SELL contracts. As a result, the net position of non-commercial traders increased by 3,500 contracts.

The fundamental backdrop still does not justify long-term buying of the pound sterling, and the currency remains at real risk of resuming a broader downtrend. The pound has gained significantly recently, but it's important to understand that this was due to Donald Trump's policies.

GBP/USD 1-Hour Analysis

This image is no longer relevant

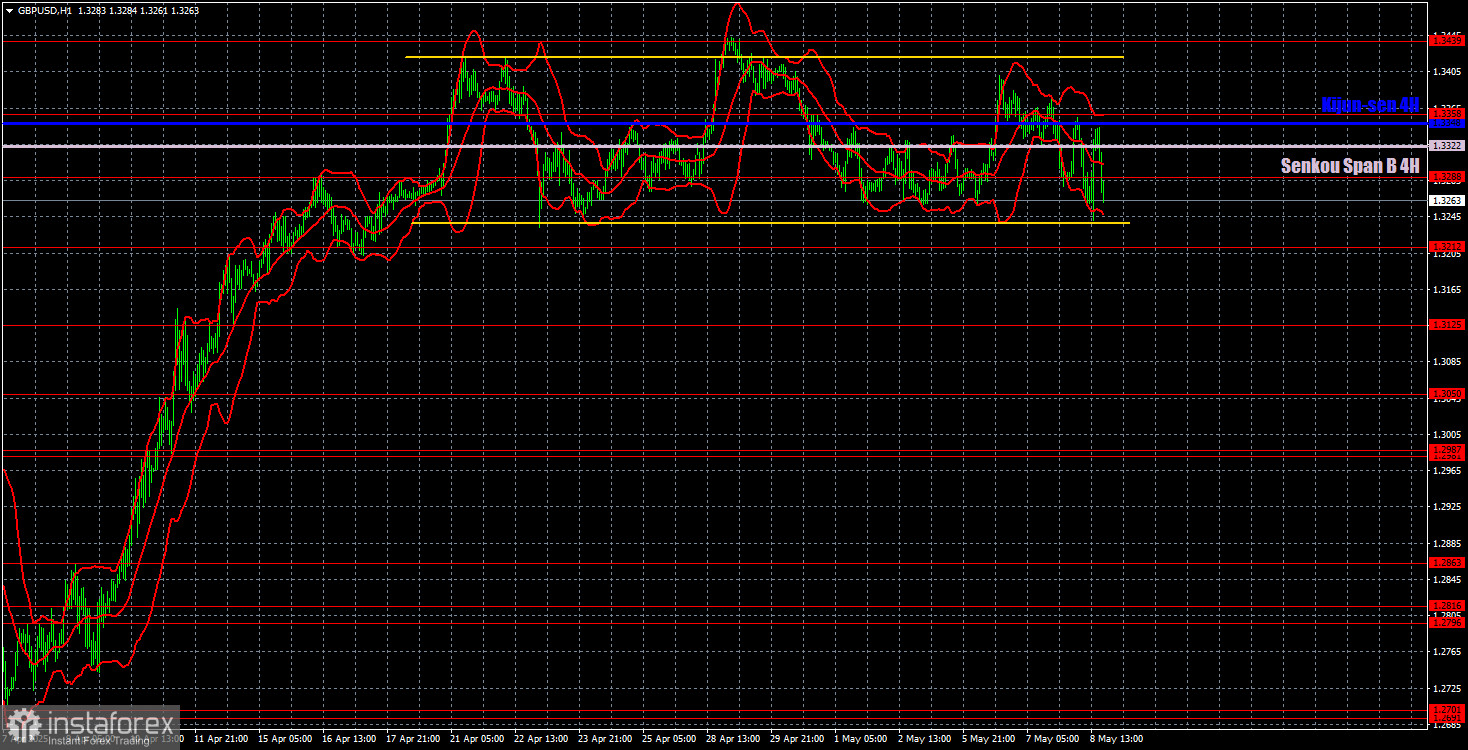
The GBP/USD pair shows an upward trend on the hourly timeframe, as the three-week flat phase hasn't invalidated the ongoing bullish trend. The pound has demonstrated robust growth in recent months, though it can hardly take credit for it — the movement has resulted mainly from the weakening U.S. dollar triggered by Donald Trump. That downward pressure on the dollar hasn't ended. The UK-U.S. trade deal has been signed but hasn't helped shield the dollar from Trump's future policy decisions. The Bank of England has cut rates, but the market seems unwilling to acknowledge it. As such, the market remains in chaos and disarray, with little to no logical consistency in price action.

Key trading levels for May 9: 1.2691–1.2701, 1.2796–1.2816, 1.2863, 1.2981–1.2987, 1.3050, 1.3125, 1.3212, 1.3288, 1.3358, 1.3439, 1.3489, 1.3537. Ichimoku lines: Senkou Span B (1.3322) and Kijun-sen (1.3348) can also act as signal levels. To protect from false signals, place a Stop Loss at breakeven once the price moves 20 pips in the right direction.

No important events are scheduled in the UK or the U.S., aside from a speech by BoE Governor Andrew Bailey. It's unclear what new information Bailey could offer the day after the Bank's policy meeting, but officially, the event could still trigger some market reaction. A firm break below the flat range would indicate that — like the euro — the pound may be preparing for a decline. However, such a drop may be limited in scale.

Illustration Explanations:

  • Support and resistance price levels – thick red lines where movement may end. They are not trading signal sources.
  • Kijun-sen and Senkou Span B lines—These are strong Ichimoku indicator lines transferred to the hourly timeframe from the 4-hour one.
  • Extremum levels – thin red lines where the price has previously rebounded. These act as trading signal sources.
  • Yellow lines – trend lines, trend channels, and other technical patterns.
  • COT Indicator 1 on the charts – the size of the net position for each category of traders.
Paolo Greco,
Analytical expert of InstaForex
© 2007-2025
Select timeframe
5
min
15
min
30
min
1
hour
4
hours
1
day
1
week
Earn on cryptocurrency rate changes with InstaForex
Download MetaTrader 4 and open your first trade
  • Grand Choice
    Contest by
    InstaForex
    InstaForex always strives to help you
    fulfill your biggest dreams.
    JOIN CONTEST

Recommended Stories

Trading Recommendations and Analysis for GBP/USD on June 12: The Pound Finds a New Reason to Cheer

On Wednesday, the GBP/USD currency pair resumed its upward movement. As previously noted, the British currency currently has no valid reason to decline against the U.S. dollar—specifically, against the U.S

Paolo Greco 04:00 2025-06-12 UTC+2

Trading Recommendations and Analysis for EUR/USD on June 12: Even Inflation Didn't Please the Dollar

The EUR/USD currency pair traded very differently throughout Wednesday. During the European trading session, the pair continued its sideways movement, which had persisted for several days. There was no macroeconomic

Paolo Greco 03:55 2025-06-12 UTC+2

GBP/USD: Trading Plan for the U.S. Session on June 11th (Review of Morning Trades)

In my morning forecast, I drew attention to the 1.3483 level and planned to make trading decisions based on it. Let's look at the 5-minute chart and analyze what happened

Miroslaw Bawulski 18:41 2025-06-11 UTC+2

EUR/USD: Trading Plan for the U.S. Session on June 11th (Review of Morning Trades)

In my morning forecast, I highlighted the 1.1425 level and planned to make entry decisions based on it. Let's look at the 5-minute chart and examine what happened. The price

Miroslaw Bawulski 18:38 2025-06-11 UTC+2

How to Trade the GBP/USD Pair on June 11? Simple Tips and Trade Analysis for Beginners

Analysis of Tuesday's Trades 1H Chart of GBP/USD On Tuesday, the GBP/USD pair traded with a downward bias, which was justified by a few factors. First, the pair consolidated below

Paolo Greco 06:10 2025-06-11 UTC+2

How to Trade the EUR/USD Pair on June 11? Simple Tips and Trade Analysis for Beginners

Analysis of Tuesday's Trades 1H Chart of EUR/USD On Tuesday, the EUR/USD currency pair again showed no intention of actively trading. Over the past three days, a sideways channel

Paolo Greco 06:10 2025-06-11 UTC+2

Trading Recommendations and Analysis for GBP/USD on June 11: The Pound Pauses Before a New Surge

The GBP/USD currency pair continued trading rather chaotically on Tuesday but with a bearish tone. The British pound at least slightly declined after the trend shifted downward. Recall that

Paolo Greco 03:31 2025-06-11 UTC+2

Trading Recommendations and Analysis for EUR/USD on June 11: Flat Movement at Highs

The EUR/USD currency pair continued to move in both directions throughout Tuesday. These movements indicate a flat market. Let us recall that earlier, the pair broke through the ascending trend

Paolo Greco 03:31 2025-06-11 UTC+2

GBP/USD: Trading Plan for the U.S. Session on June 10th (Review of Morning Trades)

In my morning forecast, I drew attention to the 1.3545 level and planned to base market entry decisions on it. Let's look at the 5-minute chart to see what happened

Miroslaw Bawulski 18:26 2025-06-10 UTC+2

EUR/USD: Trading Plan for the U.S. Session on June 10th (Review of Morning Trades)

In my morning forecast, I highlighted the level of 1.1388 and planned to make market entry decisions based on it. Let's take a look at the 5-minute chart

Miroslaw Bawulski 18:22 2025-06-10 UTC+2
Can't speak right now?
Ask your question in the chat.
Widget callback
 

Dear visitor,

Your IP address shows that you are currently located in the USA. If you are a resident of the United States, you are prohibited from using the services of InstaFintech Group including online trading, online transfers, deposit/withdrawal of funds, etc.

If you think you are seeing this message by mistake and your location is not the US, kindly proceed to the website. Otherwise, you must leave the website in order to comply with government restrictions.

Why does your IP address show your location as the USA?

  • - you are using a VPN provided by a hosting company based in the United States;
  • - your IP does not have proper WHOIS records;
  • - an error occurred in the WHOIS geolocation database.

Please confirm whether you are a US resident or not by clicking the relevant button below. If you choose the wrong option, being a US resident, you will not be able to open an account with InstaForex anyway.

We are sorry for any inconvenience caused by this message.