EUR/USD 5-Minute Analysis
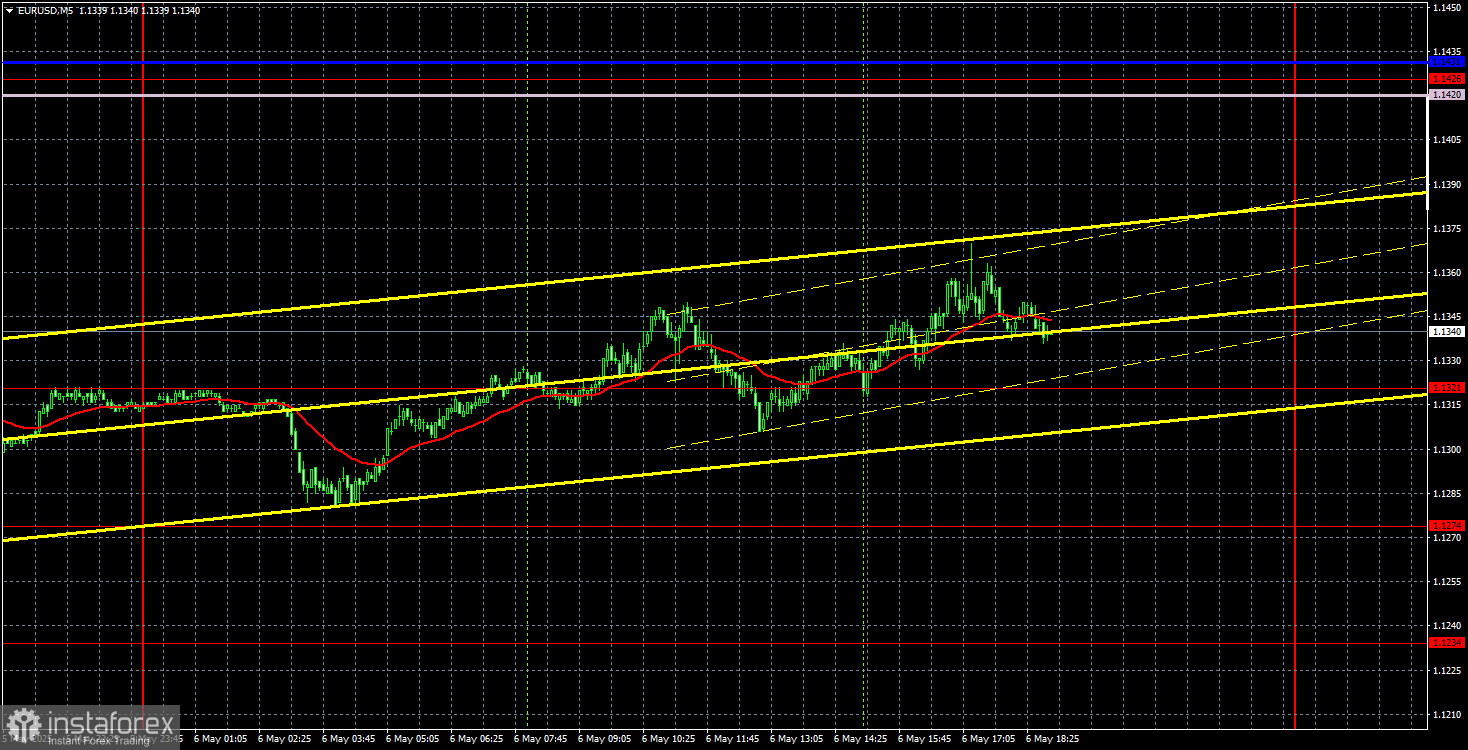
The EUR/USD currency pair continued to trade in the same sideways range on Tuesday — a flat within a flat. The broader sideways channel is bounded by the levels 1.1274 and 1.1426. The narrower one spans from 1.1274 to 1.1370. No matter how you look at it, we are in a flat market — and we've been in it for quite some time now. Recall that over the past three weeks, only two events were important enough to temporarily push the pair out of the range, only to return shortly after. These events were Trump's intention to fire Powell, followed by a public "amnesty" for the Federal Reserve Chair. Neither the U.S. GDP decline of 0.3% nor the European Central Bank's seventh consecutive rate cut caused such market reactions. It was Trump's remarks — even the ones that never materialized — that triggered significant movements. This is how the market trades today: only White House news seems to matter.
There was absolutely nothing noteworthy in terms of macroeconomic events yesterday. The services sector PMIs for Germany and the EU were of no interest. Even Monday's ISM services PMI report, which was the first in a while to trigger any real response, didn't change much overall. As such, we continue to observe sideways movement. Trading within a flat range is possible, but everyone understands that trend trading is much easier and more effective.
As for trading signals, we won't even highlight them this time. The only level crossed multiple times during the day — 1.1321 — lies within the sideways channel and therefore carries no real significance. The price moved through it back and forth at will. Once again, we remind traders that flat markets are inherently chaotic, and due to Donald Trump, there is additional disorder and unpredictability, which could turn into another bout of panic and volatility at any moment.
COT Report
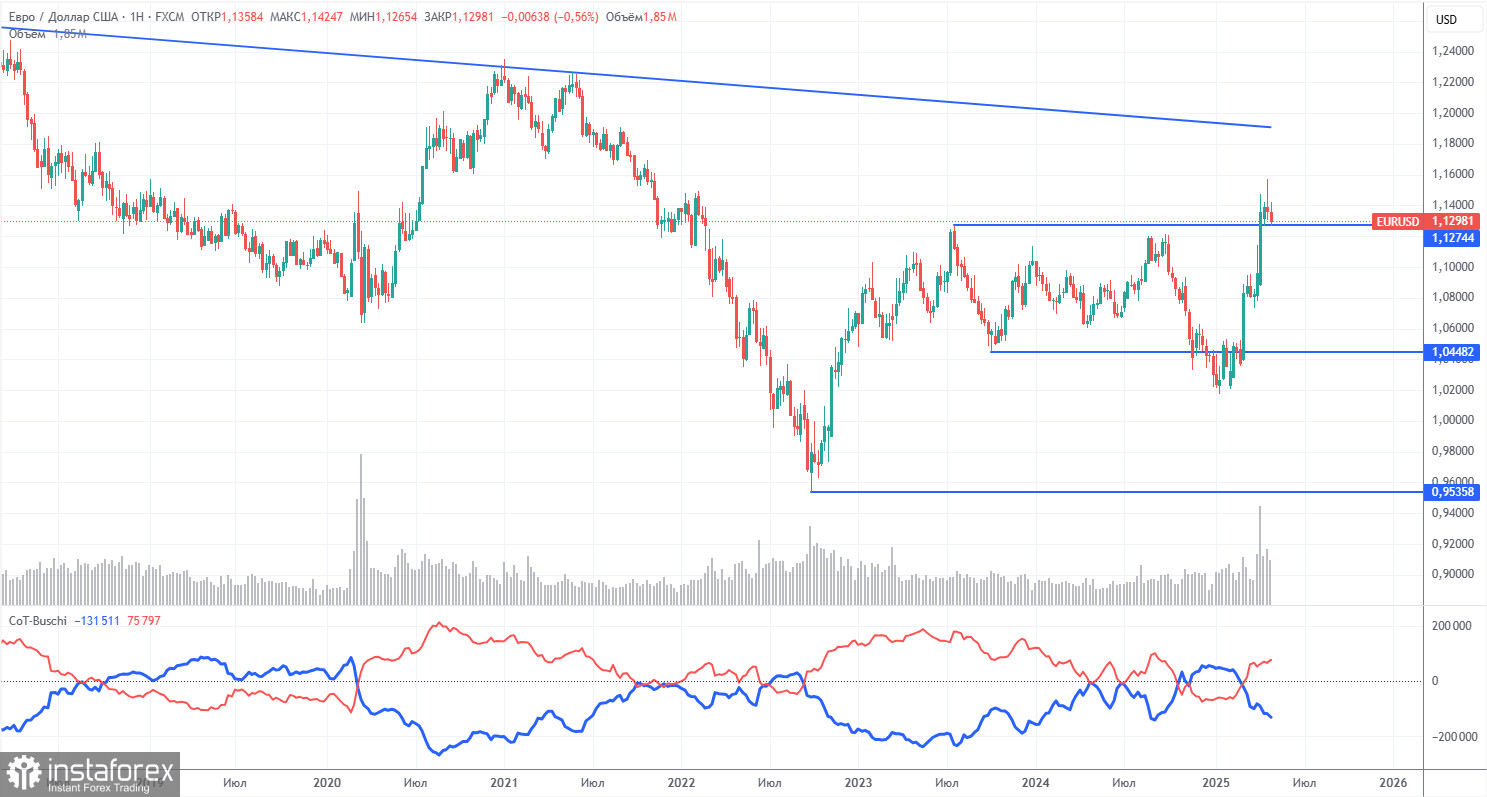
The latest Commitment of Traders (COT) report is dated April 29. The chart above clearly shows that the net position of non-commercial traders has remained bullish for a long time. Bears barely managed to gain the upper hand but quickly lost it. Since Donald Trump took office, the dollar has been on a steep decline. We cannot definitively say that this decline will continue indefinitely, and the COT reports reflect the sentiment of large players—which, under the current circumstances, can change very quickly.
Still, we continue to see no fundamental reasons for the euro to strengthen, while the dollar does have one significant reason to decline. The pair may continue to correct for a few more weeks or months, but the 16-year downtrend for the U.S. currency is unlikely to end so easily.
The red and blue lines have crossed again, signaling a bullish market trend. Over the last reporting week, long positions among non-commercial traders increased by 200, while short positions dropped by 10,600. As a result, the net position grew by 10,400 thousand contracts.
EUR/USD 1-Hour Analysis
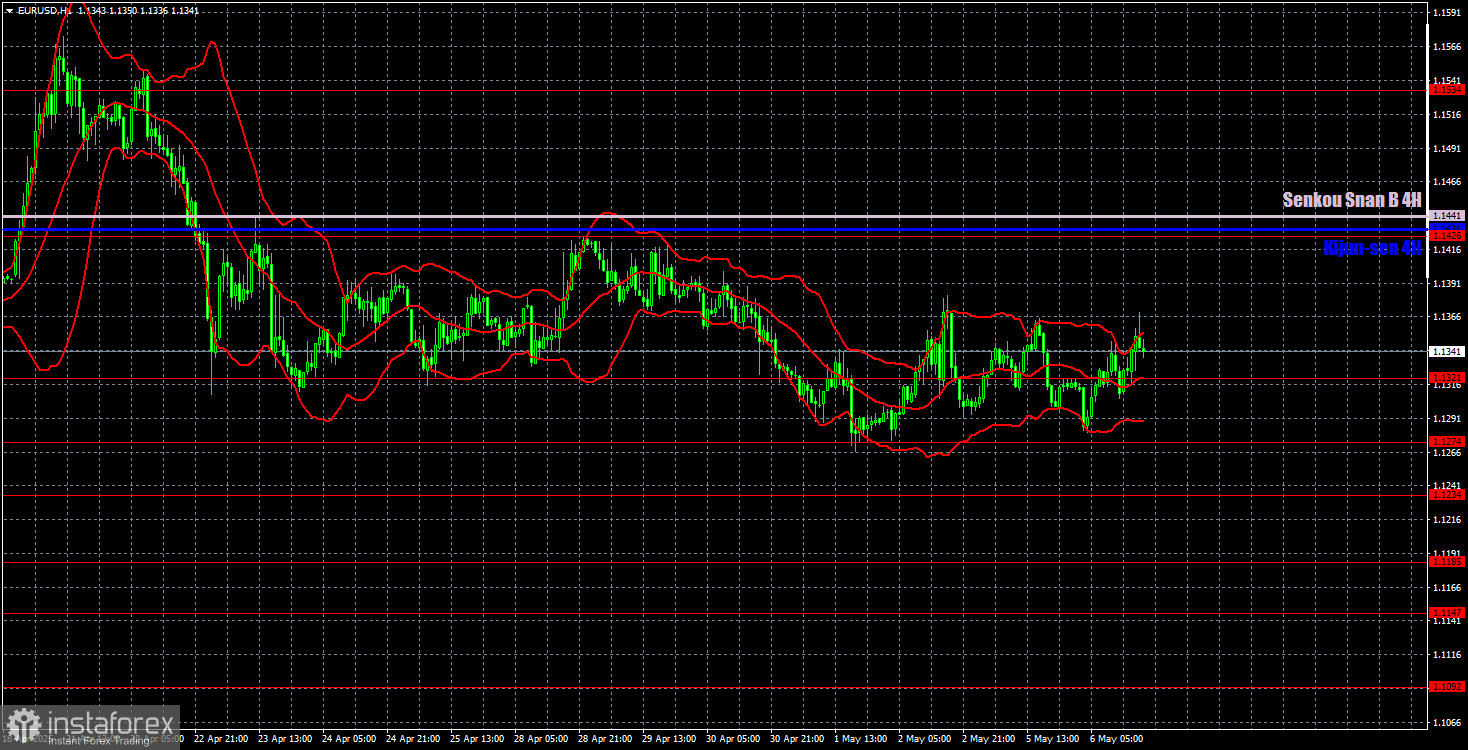
On the hourly timeframe, the EUR/USD pair maintains an upward trend but has traded sideways in recent weeks due to a lack of developments in Trump's trade negotiations. There is very little logic or technical structure to current price movements in any timeframe, and the macroeconomic backdrop has virtually no influence on the pair. The market continues to wait for news related to the trade war — either further escalation or de-escalation — and without such updates, it is unwilling to commit to a directional trade.
For May 7, we identify the following trading levels: 1.0823, 1.0886, 1.0949, 1.1006, 1.1092, 1.1147, 1.1185, 1.1234, 1.1274, 1.1321, 1.1426, 1.1534, 1.1607, and 1.1666. Also important are the Senkou Span B line (1.1441) and the Kijun-sen line (1.1431). These Ichimoku indicator lines may shift throughout the day and should be considered when determining trading signals. Remember to set a Stop Loss to breakeven once the price has moved 15 pips in your favor — this will help prevent potential losses if the signal turns out to be false.
Retail sales data in the Eurozone will be released on Wednesday, and the U.S. Federal Reserve will hold its policy meeting. Both events may fail to spark market interest. A market reaction in the evening is only likely if Powell's rhetoric diverges significantly from his recent statements.
Illustration Explanations:
- Support and resistance price levels – thick red lines where movement may end. They are not trading signal sources.
- Kijun-sen and Senkou Span B lines—These are strong Ichimoku indicator lines transferred to the hourly timeframe from the 4-hour one.
- Extremum levels – thin red lines where the price has previously rebounded. These act as trading signal sources.
- Yellow lines – trend lines, trend channels, and other technical patterns.
- COT Indicator 1 on the charts – the size of the net position for each category of traders.