GBP/USD
Brief Analysis:
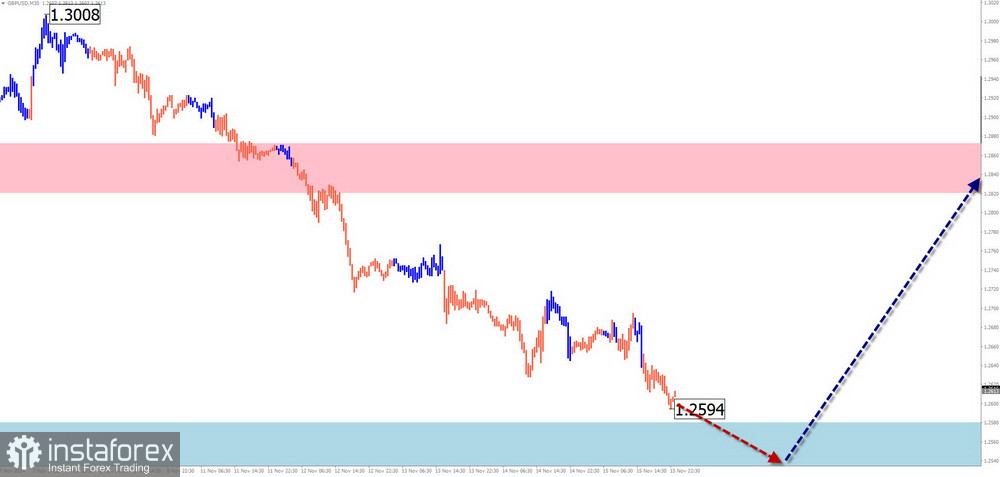
Since the end of August, the GBP/USD pair has been following a downward wave. On a larger timeframe, this section forms a corrective extended flat. The price has reached the upper boundary of a strong support zone on the daily timeframe. The wave structure seems complete, but there are no signs of an imminent reversal on the chart.
Weekly Forecast:
In the next couple of days, the British pound is expected to continue its downward trend, transitioning into a sideways movement near the resistance zone. In the second half of the week, increased activity, a reversal, and the beginning of a bullish price movement are anticipated. A temporary breakout of the lower boundary of the calculated support zone cannot be ruled out during the directional shift.
Potential Reversal Zones:
- Resistance: 1.2820/1.2870
- Support: 1.2580/1.2530
Recommendations:
- Buys: After confirmed reversal signals near the support zone, buying opportunities may be considered.
- Sales: Due to limited potential, selling is risky and may result in losses.
AUD/USD
Brief Analysis:
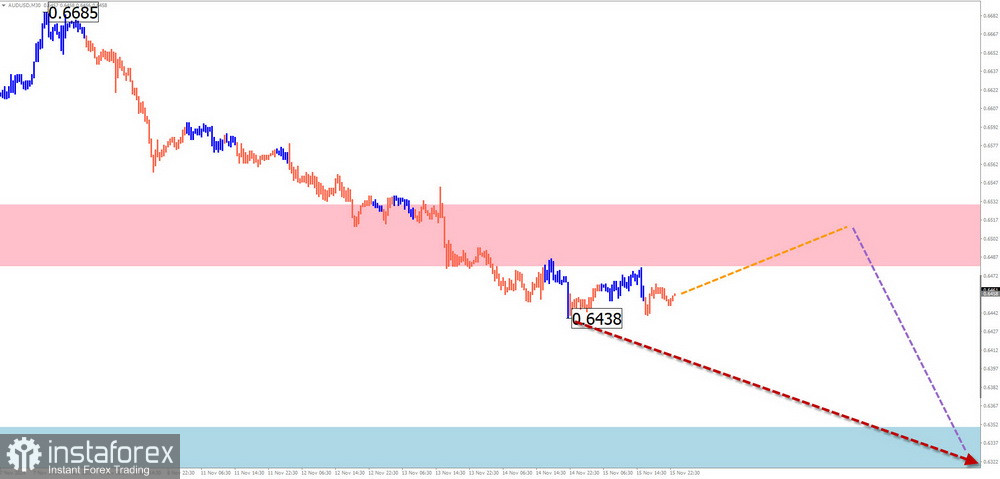
On the AUD/USD chart, the downward price movement that began at the end of September continues. On a larger scale, this section is completing a bearish extended flat. The wave structure remains incomplete.
Weekly Forecast:
A sideways drift with an upward vector is expected in the next couple of days. A reversal and the resumption of the downward trend are likely near the resistance zone. Increased market activity is expected in the second half of the week.
Potential Reversal Zones:
- Resistance: 0.6480/0.6530
- Support: 0.6350/0.6300
Recommendations:
- Sales: Relevant after corresponding reversal signals are observed in your trading systems.
- Buys: No favorable conditions for buying are expected this week.
USD/CHF
Brief Analysis:
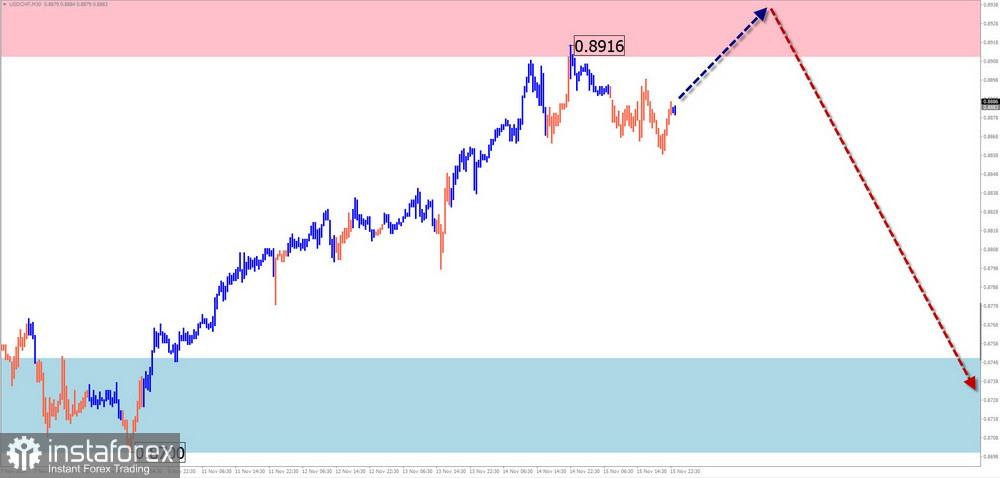
At the end of the bearish trend on the USD/CHF chart since early August, an upward wave has formed. This wave has exceeded the expected correction level and is close to completion. There are no signs of an imminent reversal on the chart. The quotes are nearing the upper boundary of a potential reversal zone.
Weekly Forecast:
The upward movement of the pair is likely to conclude in the next day or two. Following this, within the calculated resistance zone, a sideways movement is expected, setting conditions for a change in direction. A price decrease is likely by the end of the week. The calculated support zone will limit the weekly movement range of the pair.
Potential Reversal Zones:
- Resistance: 0.8910/0.8960
- Support: 0.8750/0.8700
Recommendations:
- Sales: Consider selling only after confirmed reversal signals near the resistance zone.
- Buys: Limited potential; buying may lead to losses.
EUR/JPY
Brief Analysis:
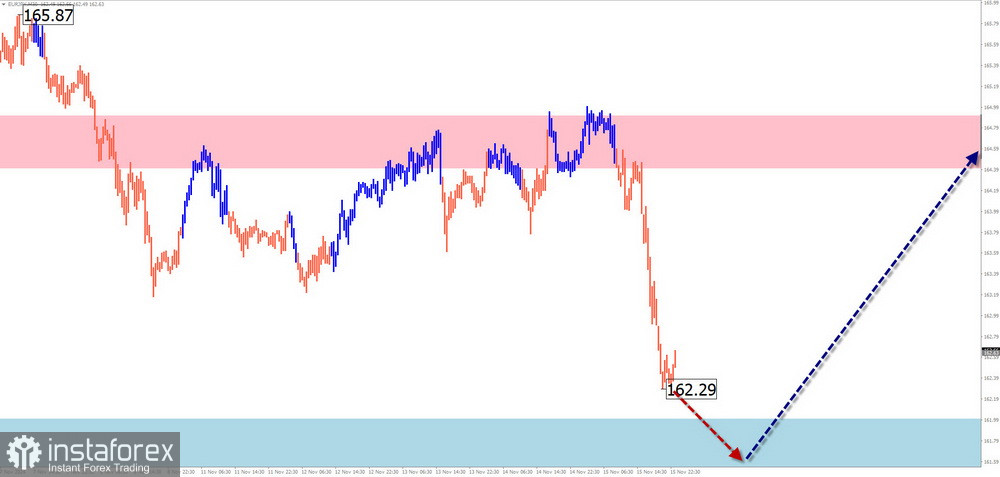
Since October last year, the EUR/JPY pair has followed a downward wave. The final part of the wave (C) is developing and nearing completion. The price has reached the upper boundary of a strong potential reversal zone.
Weekly Forecast:
At the beginning of the week, a general sideways movement is expected. A downward trend is possible, but the price will likely stay above the support boundary. A reversal is expected by the end of the week. The calculated resistance zone shows the upper boundary of the expected weekly price range.
Potential Reversal Zones:
- Resistance: 164.40/164.90
- Support: 162.00/161.50
Recommendations:
- Sales: Small lots may be used during specific sessions, targeting the support zone.
- Buys: Consider buying only after confirmed reversal signals are observed.
AUD/JPY
Analysis:
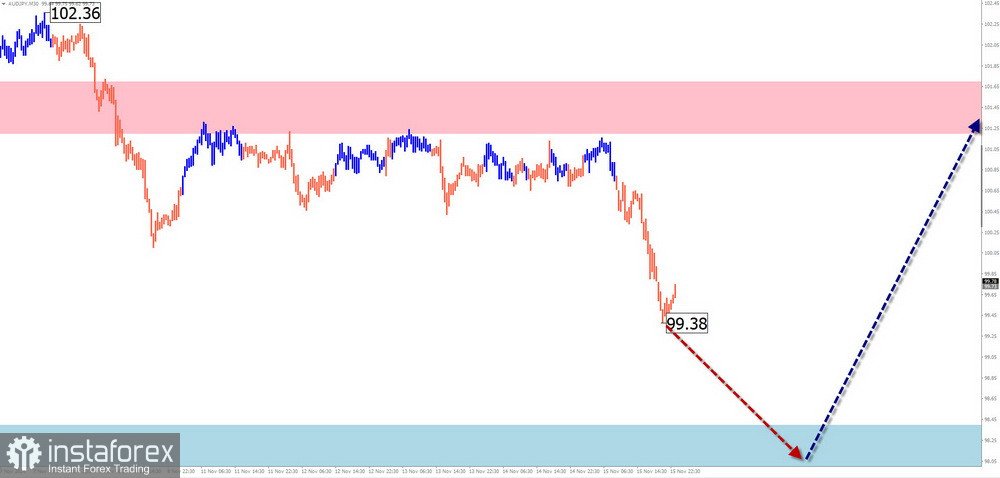
Since August, AUD/JPY price fluctuations have followed a downward wave. Since October 3, the price has been correcting in a flat movement, forming an extended flat structure. This wave is in its final phase.
Forecast:
A continued price decline is likely in the coming days. Near the calculated support zone, sideways consolidation is expected, creating conditions for a reversal. An upward price movement is likely to resume by the end of the current or next week. The calculated zones indicate the expected weekly price range for the pair.
Potential Reversal Zones:
- Resistance: 101.20/101.70
- Support: 98.40/97.90
Recommendations:
- Sales: Limited potential; small volume sales may be used in specific sessions.
- Buys: Consider buying after confirmed reversal signals near the support zone.
EUR/CHF
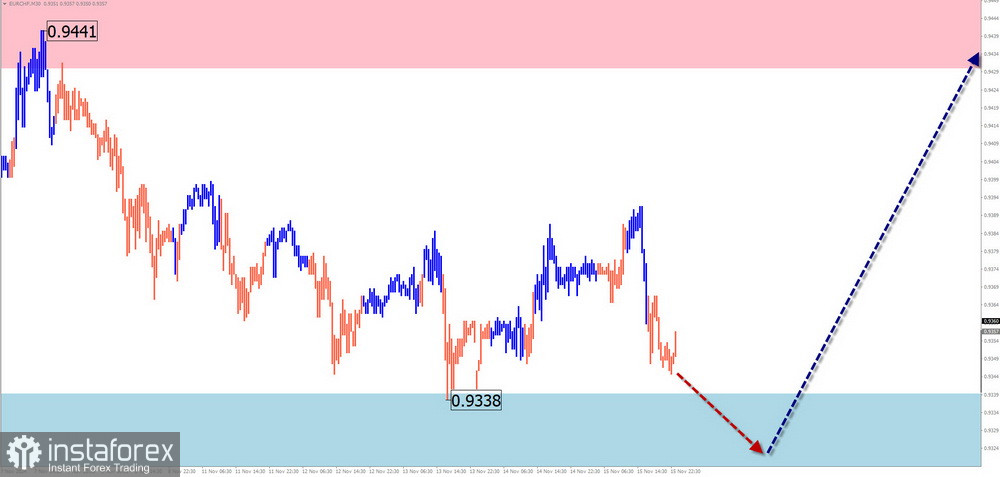
Brief Analysis:
Since January, EUR/CHF price fluctuations have followed a downward wave. Recently, the price has been correcting and moving sideways. The price is now near the upper boundary of a strong potential reversal zone on the daily timeframe.
Weekly Forecast:
A general sideways movement is expected this week. Brief pressure on the lower boundary of the support zone may occur in the early days. A return to a bullish trend is likely by the weekend. The calculated zones indicate the expected price range for the week.
Potential Reversal Zones:
- Resistance: 0.9430/0.9480
- Support: 0.9340/0.9290
Recommendations:
- Buys: Consider buying after confirmed reversal signals near the support zone.
- Sales: Risky and may lead to losses.
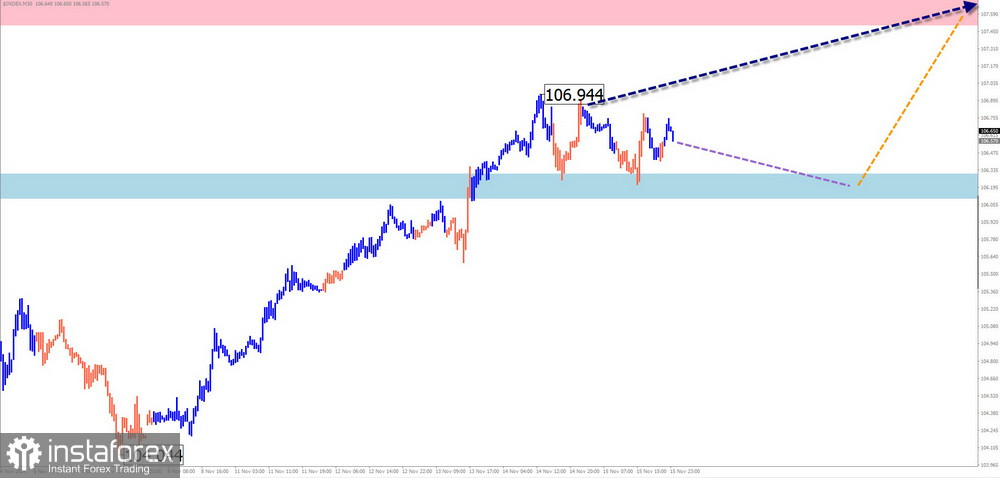
US Dollar Index
Brief Analysis:
Since late September, the US Dollar Index has been on an upward trend. The wave structure appears to be complete. The index is now approaching the upper boundary of a potential reversal zone on the weekly scale. However, no signs of an imminent reversal are evident on the chart.
Weekly Forecast:
The sideways trend in the US Dollar Index is expected to continue in the first half of the week. Toward the weekend, the index is likely to resume its bullish trend and rise toward the calculated resistance zone.
Potential Reversal Zones:
- Resistance: 107.50/107.70
- Support: 106.30/106.10
Recommendations:
- Buys: National currencies in major pairs can be traded in the next few days. Afterward, wait for a reversal in the USDollar trend and focus on selling major currencies.
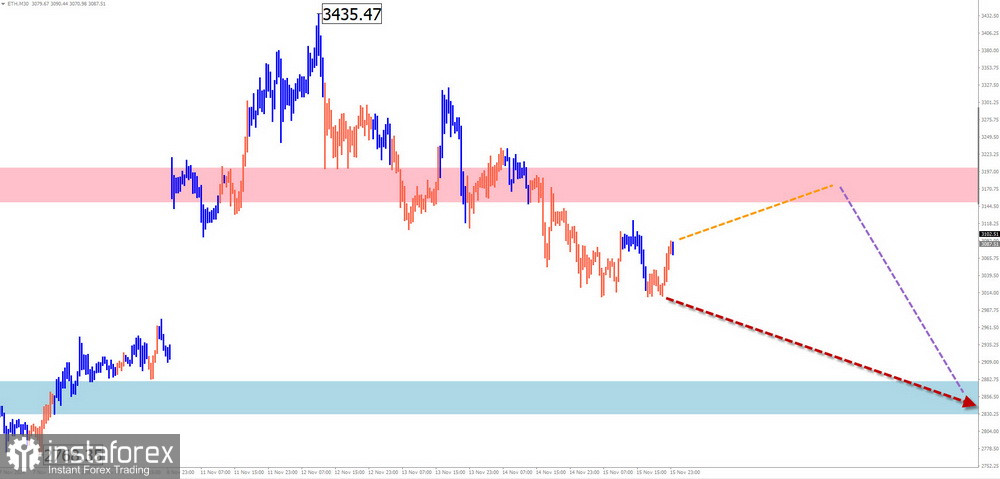
Ethereum
Analysis:
Since August 5, the upward wave on the Ethereum chart has dictated the main price movement. On the daily timeframe, this section marks the beginning of the final part of wave (C). Recently, a correction has been forming in a horizontal movement resembling an extended flat. The structure is incomplete.
Forecast:
Sideways movement is expected in the next couple of days, with possible testing of the calculated resistance zone. A directional change is likely afterward. Increased price volatility is expected in the second half of the week, with a potential decline toward the support zone.
Potential Reversal Zones:
- Resistance: 3150.0/3200.0
- Support: 2880.0/2830.0
Recommendations:
- Buys: Limited potential; small volume purchases may be used in specific sessions.
- Sales: Recommended only after confirmed signals near the resistance zone.
Explanations: In the Simplified Wave Analysis (SWA), all waves consist of 3 parts (A-B-C). The last incomplete wave is analyzed on each timeframe. Expected movements are shown by dashed lines.