Ether is currently the second-largest digital currency by market capitalization after bitcoin. Many experts think that ether has far more advantages than bitcoin. Yet, one should choose completely different strategies when trading these digital assets despite some similar features between them. The growth rate of ether is significantly higher compared to bitcoin. It is associated with different groups of traders that buy these altcoins. Support levels in the crypto market are formed in another way as well as breakouts of resistance levels. However, to start trading ETH/USD, it is necessary to use familiar technical indicators on the horizontal charts.
The Relative Strength Index (RSI) is a technical indicator that allows traders to determine the force of a trend (descending or ascending) and foresee possible changes in the price movement. Thanks to this indicator, it is possible to identify at what level an asset will become overbought or oversold. The optimal level for this indicator is 60 if we need a bullish trend. It indicates a high demand for the coin and the strength of the current upward momentum. When crossing this level, the digital asset begins to move to the overbought zone.
The moving average convergence divergence (MACD) is a popular technical momentum indicator that helps traders draw certain conclusions about the trend based on the movement of moving averages and the relation between the two moving averages. It signals bullish momentum when the intersection of the white line under the red occurs. It indicates bearish momentum when the white line from above crosses the red.
A stochastic Oscillator, also referred to as a Stochastic Indicator, is a momentum indicator that helps determine the direction of the prevailing trend. If the indicator is above the 80 level, then the asset is overbought. If it is below 20, then the asset is oversold.
Notably, demand for ether among retail traders is growing thanks to several reasons. Firstly, it is not as institutionalized as BTC, which helps ether lesser dependence on the flows of large capital. In addition, the speed and security of transactions on the ETH network are much better than that of bitcoin. The recent London hard fork update has significantly reduced the size of commissions, attracting a large number of individual traders. The main advantage of ether is a developed ecosystem that allows using the capabilities of the DeFi and NFT market. Ether managed to increase transaction volumes by 260% amid these developments.
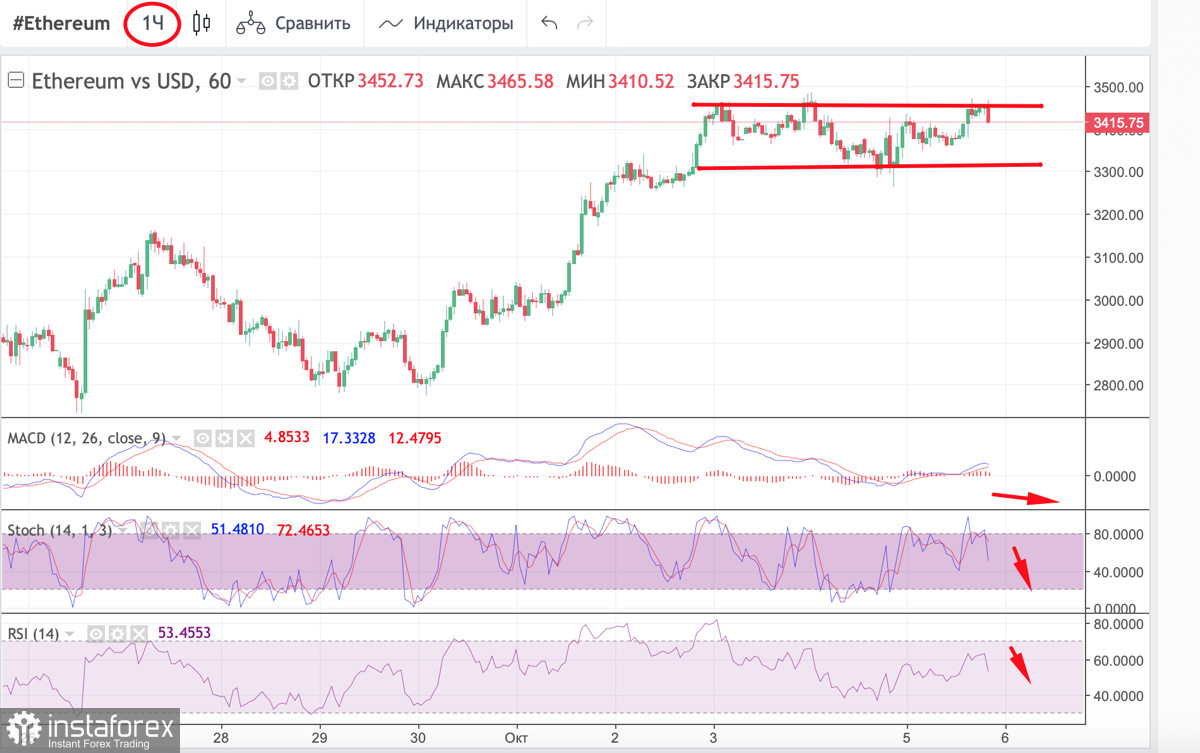
As of October 5, ETH/USD was trading at $3,400. Analysts are sure that ether is likely to reach a new all-time high amid positive sentiment in the crypto market. Analysis of technical charts helps you to determine the main trend of the cryptocurrency by looking at what level it is located. Technical indicators may also provide clues on how long it takes for the digital asset to reach a new high. The 1H chart shows that the altcoin has been consolidating since early October. It struggles to break through the $3,500 level due to a big number of short positions orders after the recent market collapse.
The $3,500 level is the lower limit of the resistance zone, which ends after the digital asset reaches $3,650. When the cryptocurrency breaks out of this area, an upward movement will begin to the next resistance level near $4,000. On the 1H chart, technical indicators signal a downward movement. The stochastic oscillator shows a strong bearish signal. It fell below the 50 mark. The MACD indicator is also close to forming a bearish intersection, which indicates the weakness of bulls. It seems that traders stick to the wait-and-see approach.
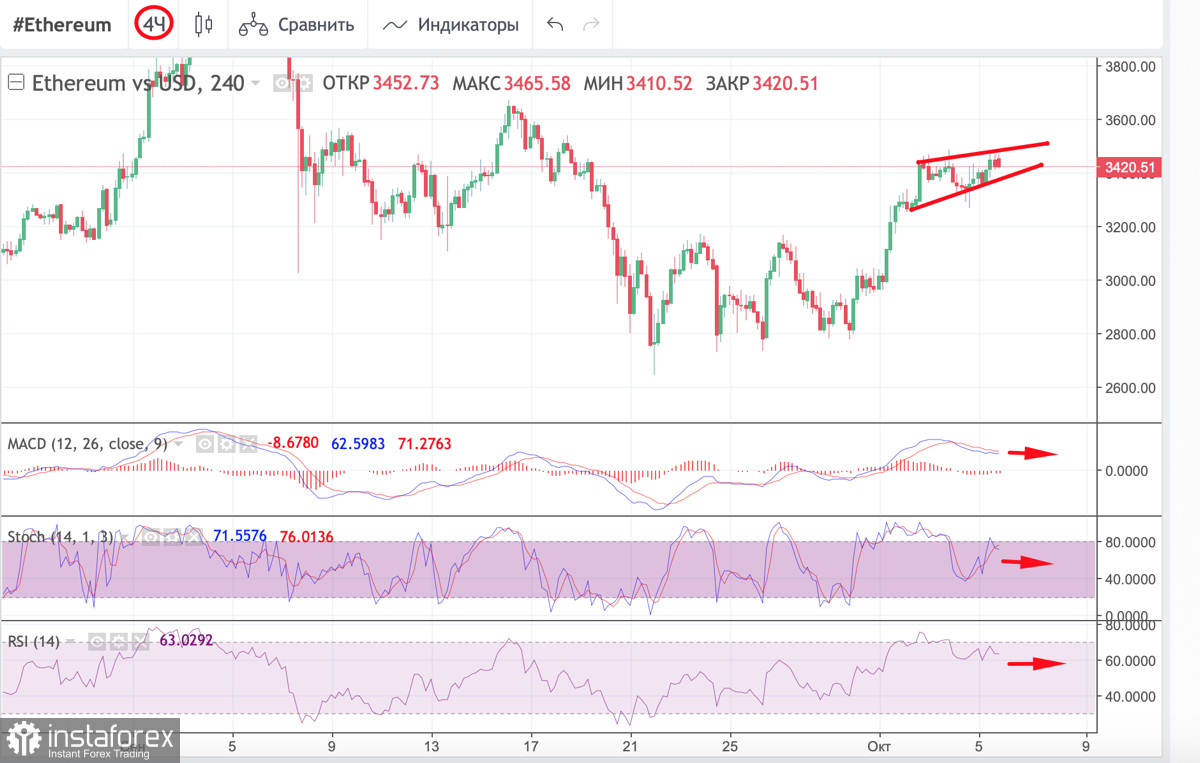
On the 4H chart, the indicators have stabilized. They signal the accumulation phase, which may lead to a possible breakout of $3,500 tonight. However, traders are concerned by the formation of a bearish wedge on the charts, which may indicate a decline. This is why the virtual asset is unlikely to break through the $3,500 mark. It means that the altcoin will remain within the accumulation zone. At the same time, the MACD and the RSI index are moving sideways, which indicates the absence of strong bullish or bearish momentum. However, taking into account the formation of a bearish figure, bears are likely to gain momentum. Stochastic continues to move up. At the same time, it signals the weakness of the bullish momentum and the formed bullish intersection is unlikely to change the situation.
A wedge pattern can signal either bullish or bearish price reversals on the horizontal charts. It indicates that the price has reached local highs followed by a further price drop or trend reversal.
The bearish triangle or descending triangle is a bearish formation on the horizontal charts that anticipates a downside breakout. Ascending triangles are a bullish formation that anticipates an upside breakout.
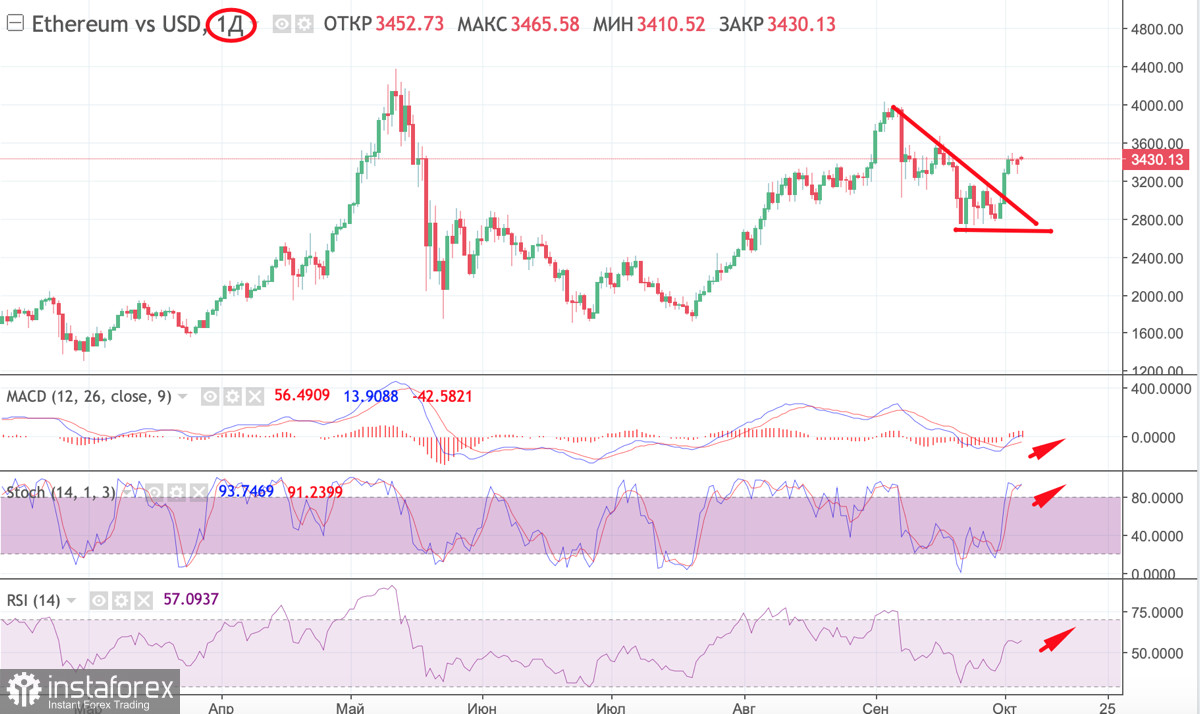
On the daily chart, ETH/USD went beyond the bearish triangle. Now, the price is trying to consolidate above this zone. however, the dominance of bears can be seen on smaller timeframes. However, the technical indicators show that the consolidation phase is coming to an end. The MACD indicator has entered the red zone. Yet, it continues to grow, as does the stochastic, which has formed a bullish intersection. It is moving above the 80 mark. At the same time, the RSI indicator began a sideways movement along the 60 mark. It signals a possible strengthening of the current bullish momentum. However, in general, technical indicators show a correctional phase that will begin in the near future. After the correctional phase, the price will try to break above $3,500. It may rise on October 6. So, it is recommended to open long traders on ETH with prospects of growth above $4,000.