Minor operational scale (H4)
Let's consider the comprehensive analysis of the development options for the movement of currency instruments AUD / USD vs USD / CAD vs NZD / USD vs #USDX (based on the results of the first half of August) from August 13, 2019 on the Minor operational scale (daily timeframe).
____________________
US dollar Index
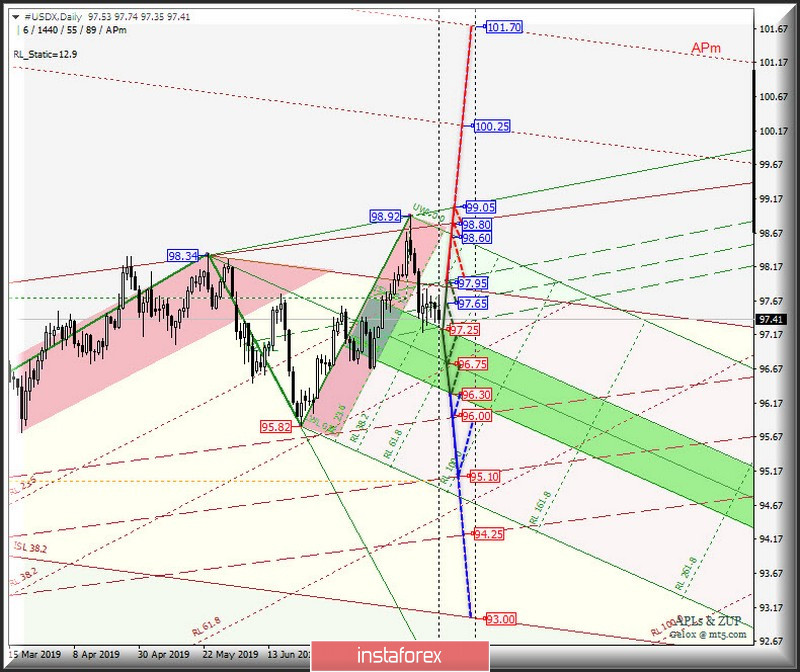
From August 13, 2019, the development of the movement of the dollar index #USDX will be determined by the development and the direction of the breakdown of the boundaries of the 1/2 Median Line channel (97.95 - 97.65 - 97.25) of the Minuette operational scale fork. We look at the movement graphics within this channel on the animation chart.
The breakdown of the support level of 97.25 on the lower boundary of the 1/2 channel of the Median Line Minuette will determine the development of the movement of the dollar index in the equilibrium zone (97.25 - 96.75 - 96.30) of the Minuette operational scale fork with the prospect of reaching the upper limit (96.00) of the 1/2 Median Line channel of the Minor operational scale (95.10).
On the other hand, if the upper boundary (resistance level of 97.95) is broken through the 1/2 Median Line channel of the Minuette operational scale fork, the upward movement of #USDX can be continued to the targets - the initial line SSL Minuette (98.60) - the control line UTL (98.80) of the Minor operational scale fork - the control line UTL Minuette (99.05).
The markup of #USDX movement options from August 13, 2019 is shown in the animated chart.
____________________
Australian dollar vs US dollar
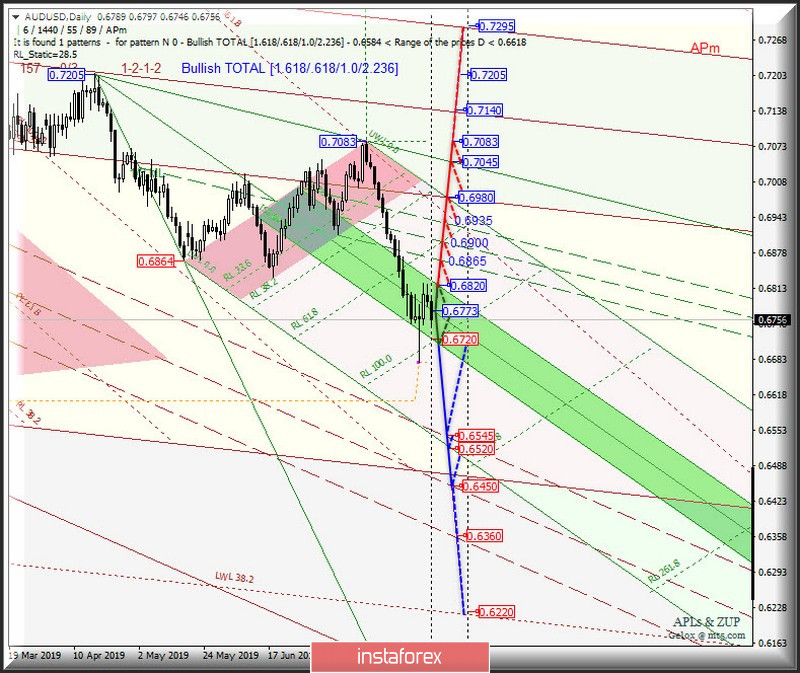
The development of the movement of the Australian dollar/ US dollar (AUD / USD) from August 13, 2019 will be due to the development and direction of the breakdown of the boundaries of the equilibrium zone (0.6820 - 0.6773 - 0.6720) of the Minuette operational scale fork. The details of the movement inside the equilibrium zone are shown in the animation chart.
The breakdown of the upper boundary of ISL38.2 (resistance level of 0.6820) of the equilibrium zone of the Minuette operational scale fork will determine the development of the movement of the Australian dollar to the boundaries of the 1/2 Median Line Minuette channel (0.6865 - 0.6900 - 0.6935), and if breakdown of the upper boundary (0.6935) of this channel will happen, the continuation of the upward movement towards the targets is possible - the lower boundary of the ISL61.8 (0.6980) equilibrium zone of the Minor operational scale fork - the control line UTL Minuette (0.7045) - local maximum 0.7083.
In the event of a breakdown of the lower boundary of ISL61.8 (support level of 0.6720) of the equilibrium zone of the Minuette operational scale fork, there will be a continuation of the downward movement of AUD / USD to the boundaries of the 1/2 Median Line channel (0.6545 - 0.6450 - 0.6360) of the Minor operational scale fork.
From August 13, 2019, we look at the layout of the AUD / USD movement options in the animated chart.
____________________
New Zealand dollar vs US dollar
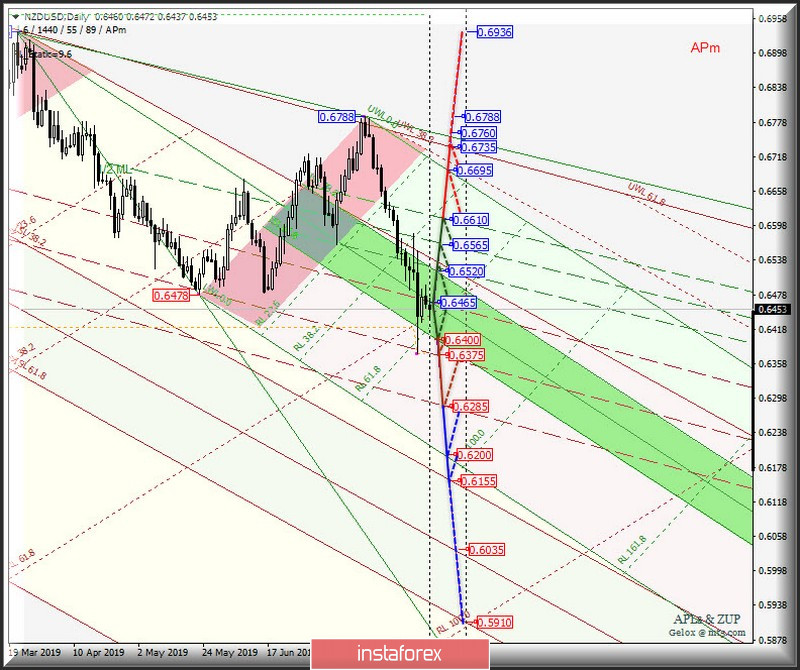
The development and direction of the breakdown of the boundaries of the equilibrium zone (0.6520 - 0.6465 - 0.6400) of the Minuette operational scale will determine the development of the movement of the New Zealand dollar/US dollar (NZD / USD) in August 2019. The movement markings in the 1 / 2 Median Line Minuette channel are indicated in the animation chart.
The breakdown of the resistance level of 0.6520 at the upper boundary of the ISL38.2 equilibrium zone of the Minuette operational scale fork will make the development of the NZD / USD movement in the 1/2 Median Line Minuette channel (0.6520 - 0.6565 - 0.6610) relevant with the prospect of reaching the SSL Minuette start line (0.6695) and the control line UTL (0.6735) Minor operating scale fork.
Meanwhile, if the breakdown of the lower boundary of ISL61.8 (support level of 0.6585) of the equilibrium zone of the Minuette operational scale fork takes place, then the downward movement of the New Zealand dollar/US dollar will be directed to the targets - 1/2 Median Line Minor (0.6375) - the lower boundary of the 1/2 Median Line Minor channel (0.6285) - the end line of SSL Minuette (0.6200).
We look at the layout of the NZD / USD movement options from August 13, 2019 in the animated chart.
____________________
US dollar vs Canadian dollar
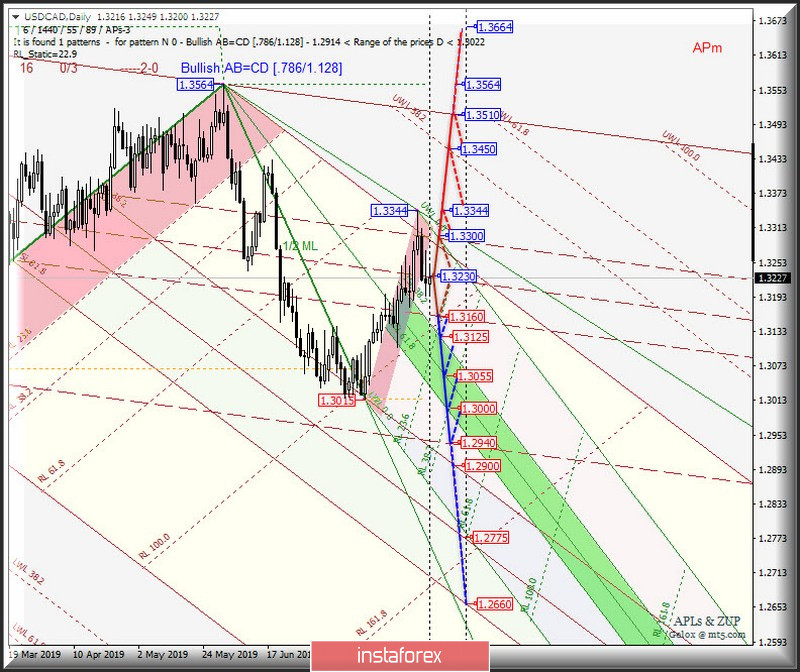
The development and direction of the breakdown of the boundaries of the 1/2 Median Line channel (1.3300 - 1.3230 - 1.3160) of the Minor operational scale will determine the development of the movement of the USD / CAD from August 13, 2019. The details of the movement inside this channel are shown in the animation chart.
The breakdown of the lower boundary of the 1/2 Median Line channel (support level of 1.3160) of the Minor operational scale fork will allow the downward movement of the Canadian dollar to continue towards the boundaries of the equilibrium zone (1.3125 - 1.3055 - 1.3000) of the Minuette operational scale fors with the prospect of reaching the final Schiff Line Minor (1.2940).
As a result of the breakdown of the resistance level of 1.3300 (the upper boundary of the 1/2 Median Line channel of the Minor operational scale fork), it will become possible to continue the upward movement of USD / CAD to the targets - local maximum 1.3344 - warning line UWL38.2 Minor (1.3450) - control line UTL Minor (1.3510).
From August 13, 2019, we are looking at the markup of the USD / CAD movement options in the animated chart.
____________________
The review is made without taking into account the news background. The opening of trading sessions of the main financial centers does not serve as a guide to action (placing orders "sell" or "buy").
The formula for calculating the dollar index:
USDX = 50.14348112 * USDEUR0.576 * USDJPY0.136 * USDGBP0.119 * USDCAD0.091 * USDSEK0.042 * USDCHF0.036.
where the power coefficients correspond to the weights of the currencies in the basket:
Euro - 57.6%;
Yen - 13.6%;
Pound Sterling - 11.9%;
Canadian dollar - 9.1%;
Swedish Krona - 4.2%;
Swiss franc - 3.6%.
The first coefficient in the formula leads the index to 100 at the start date of the countdown - March 1973, when the main currencies began to be freely quoted relative to each other.