

signal strength 2 of 5

According to the chart of M15, #Bitcoin formed the Bullish Symmetrical Triangle pattern, which signals the trend will continue. Description. The upper border of the pattern touches the coordinates 109440.14/108872.57 whereas the lower border goes across 108311.13/108872.57. The pattern width is measured on the chart at 112901 pips. If the Bullish Symmetrical Triangle pattern is in progress during the upward trend, this indicates the current trend will go on. In case 108872.57 is broken, the price could continue its move toward 108872.80.
The M5 and M15 time frames may have more false entry points.
See Also
- All
- Double Top
- Flag
- Head and Shoulders
- Pennant
- Rectangle
- Triangle
- Triple top
- All
- #AAPL
- #AMZN
- #Bitcoin
- #EBAY
- #FB
- #GOOG
- #INTC
- #KO
- #MA
- #MCD
- #MSFT
- #NTDOY
- #PEP
- #TSLA
- #TWTR
- AUDCAD
- AUDCHF
- AUDJPY
- AUDUSD
- EURCAD
- EURCHF
- EURGBP
- EURJPY
- EURNZD
- EURRUB
- EURUSD
- GBPAUD
- GBPCHF
- GBPJPY
- GBPUSD
- GOLD
- NZDCAD
- NZDCHF
- NZDJPY
- NZDUSD
- SILVER
- USDCAD
- USDCHF
- USDJPY
- USDRUB
- All
- M5
- M15
- M30
- H1
- D1
- All
- Buy
- Sale
- All
- 1
- 2
- 3
- 4
- 5
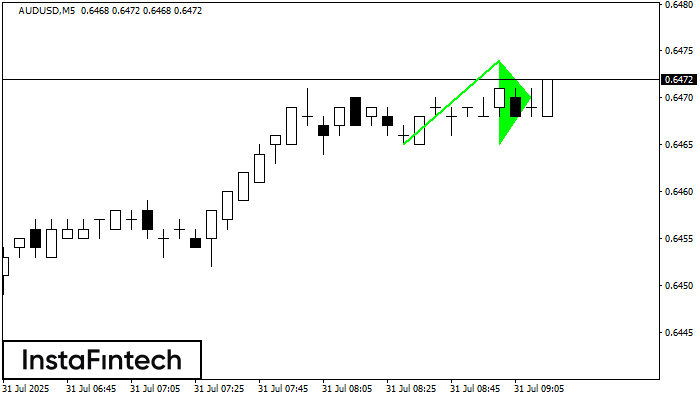
The Bullish pennant signal – Trading instrument AUDUSD M5, continuation pattern. Forecast: it is possible to set up a buy position above the pattern’s high of 0.6474, with the prospect
The M5 and M15 time frames may have more false entry points.
Open chart in a new window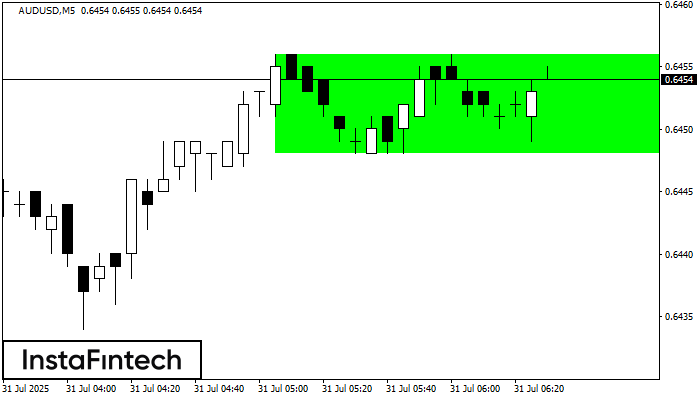
According to the chart of M5, AUDUSD formed the Bullish Rectangle which is a pattern of a trend continuation. The pattern is contained within the following borders: the lower border
The M5 and M15 time frames may have more false entry points.
Open chart in a new window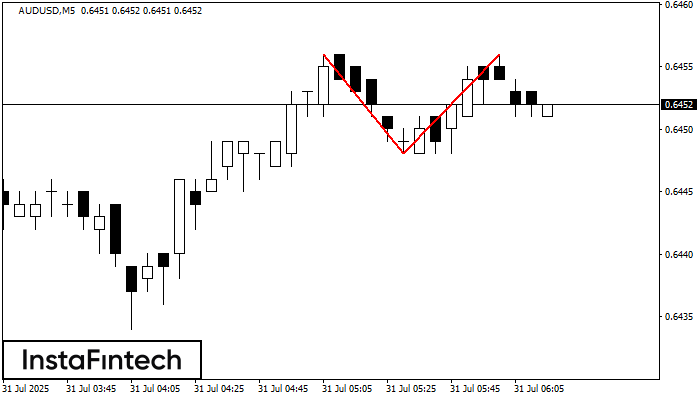
On the chart of AUDUSD M5 the Double Top reversal pattern has been formed. Characteristics: the upper boundary 0.6456; the lower boundary 0.6448; the width of the pattern 8 points
The M5 and M15 time frames may have more false entry points.
Open chart in a new window


