empty
22.04.2025 06:58 AM
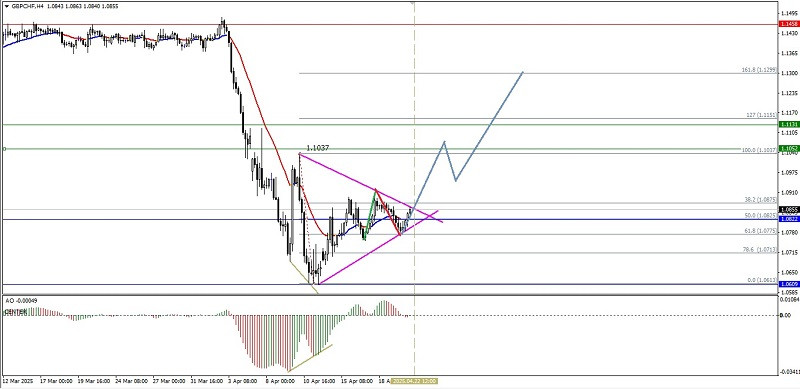
Technical Analysis of Intraday Price Movement of GBP/CHF Cross Currency Pairs, Tuesday April 22, 2025.

This image is no longer relevant

If we look at the 4-hour chart of the GBP/CHF cross currency pair, there are several interesting facts. First, the appearance of a Triangle pattern followed by the movement of its EMA (21) which moves between the candle bodies indicates that the current condition of GBP/CHF is moving in a Sideways condition, even so, with the appearance of Divergence between the GBP/CHF price movement and the Awesome Oscillator indicator, it gives an indication that in the near future there is a potential for strengthening that will occur where the level of 1.1037 will be tested. If it is successfully broken and closes above it, then GBP/CHF has the potential to continue its strengthening to the level of 1.1151 as its main target and 1.1299 as its second target if the volatility and momentum of its strengthening support it, but if on its way to the target levels, GBP/CHF suddenly corrects and weakens quite significantly, especially if it breaks and closes below the level of 1.0754, then all strengthening scenarios that have been described previously will become invalid and automatically canceled by themselves.

(Disclaimer)

Select timeframe
5
min
15
min
30
min
1
hour
4
hours
1
day
1
week
Earn on cryptocurrency rate changes with InstaForex
Download MetaTrader 4 and open your first trade
  • Grand Choice
    Contest by
    InstaForex
    InstaForex always strives to help you
    fulfill your biggest dreams.
    JOIN CONTEST

Recommended Stories

WTI - West Texas Intermediate. Analysis and Forecast

Prices for U.S. crude oil West Texas Intermediate (WTI) are consolidating near a one-month high, pausing a four-day winning streak, although the intraday pullback lacks bearish conviction. WTI prices

Irina Yanina 17:55 2025-05-14 UTC+2

EUR/USD Analysis on May 14, 2025

On Tuesday, the EUR/USD pair rebounded from the support zone of 1.1074–1.1081 and reversed in favor of the euro, climbing by 110 points. Thus, the bears' joy was short-lived

Samir Klishi 11:20 2025-05-14 UTC+2

GBP/USD Analysis on May 14, 2025

On the hourly chart, the GBP/USD pair continued its upward movement on Tuesday after bouncing off the 1.3139 level. Judging by the wave structure, the bearish trend has not been

Samir Klishi 11:17 2025-05-14 UTC+2

Forex forecast 14/05/2025: EUR/USD, GBP/USD, Oil, Ethereum and Bitcoin

Useful links: My other articles are available in this section InstaForex course for beginners Popular Analytics Open trading account Important: The begginers in forex trading need to be very careful

Sebastian Seliga 10:01 2025-05-14 UTC+2

Technical Analysis of Intraday Price Movement of AUD/JPY Cross Currency Pairs, Wednesday May 14, 2025.

Although on the 4-hour chart the AUD/JPY cross currency pair is still moving above the WMA (30 Shift 2) which also has a slope that is going upwards, but because

Arief Makmur 07:42 2025-05-14 UTC+2

Technical Analysis of Daily Price Movement Crude Oil Commodity Instrument, Wednesday May 14, 2025.

From what is seen on the 4-hour chart of the Crude Oil commodity instrument, there are several interesting facts, first the appearance of a Double Bottom pattern followed by Convergence

Arief Makmur 07:42 2025-05-14 UTC+2

EUR/USD Forecast for May 14, 2025

On Tuesday, the euro chose not to continue resisting market sentiment and joined the broader risk-on trend. The U.S. stock index S&P 500 rose by 0.72%, the dollar index declined

Laurie Bailey 05:03 2025-05-14 UTC+2

GBP/USD Forecast for May 14, 2025

Amid yesterday's surge in risk appetite and general market optimism (S&P 500 +0.72%, WTI +2.78%, Dollar Index -0.76%), the British pound did not attempt to test the target support

Laurie Bailey 05:03 2025-05-14 UTC+2

AUD/USD Forecast for May 14, 2025

The Australian dollar has broken above the 0.6394–0.6444 range. The signal line of the Marlin oscillator reversed upward before reaching the boundary of the bearish zone. Considering possible fluctuations, allowing

Laurie Bailey 05:03 2025-05-14 UTC+2

Trading Signals for GOLD for May 12-15, 2025: buy above $3,225 (200 EMA - 6/8 Murray)

Early in the American session, gold is trading around 3,249, rebounding after reaching the low of 3,224, which coincided with the 200 EMA. After reaching this bottom, gold is rebounding

Dimitrios Zappas 18:50 2025-05-13 UTC+2
Can't speak right now?
Ask your question in the chat.
Widget callback